Trading Update: Friday September 17, 2021
Emini pre-open market analysis
Emini daily chart
- Yesterday was doji bar and inside bar after Wednesday’s strong reversal up from the bottom of the bull channel and from just above the 50-day MA.
- It is both a buy signal bar and a sell signal bar.
- Since it was a bear doji after 4 big bear bars and there is a 6-day bear micro channel, the first rally might form a lower high at around 4500, followed by a test back down to Tuesday’s low and the 50-day EMA. This is not a particularly strong buy setup.
- Because the Emini is just above the 50-day MA, it might have to go sideways to down to get there. Many traders are not convinced that it has been adequately tested, especially after 4 big bear days.
- Since the 50-day EMA has been reliable support for over a year, there will probably be buyers not far below yesterday’s low.
- However, there is a 50% chance that September 2 will remain the high for the rest of 2021.
- A 15 to 20% correction is likely to begin in September or October and it might be underway. If it is, there could be a collapse below the 50-day MA and bottom of the bull channel before there is a new all-time high.
- After 4 sideways days and with a weak buy and sell setup, the Emini has an increased chance of going mostly sideways and a little up into next Wednesday’s FOMC announcement.
Emini 5-minute chart and what to expect today
- Emini is down 2 points in the overnight Globex session.
- Yesterday was an inside day and the 4th sideways day. That increases the chance of another mostly sideways day. However, even if it is, the daily ranges have been big enough for swings in both directions.
- With today opening in the middle of yesterday’s range, it could be a 2nd consecutive inside day. There would then be an ii (inside-inside) Breakout Mode pattern ahead of Wednesday’s FOMC announcement.
- 4 sideways days also increases the chance of sellers near yesterday’s high and buyers near yesterday’s low.
- Since today is Friday, weekly support and resistance can be important, especially in the final hour. So far, this week is a small bear doji candlestick. Therefore, the open of the week is important.
- The bulls want a bull reversal bar on the weekly chart. They would also like this week to get back above the 4500 Big Round Number and the open of the month.
- The bears want the week to close on the low, below the bottom of the now 5-day tight trading range, the 50-day MA, and the bottom of the bull channel on the weekly chart.
Yesterday’s Emini setups

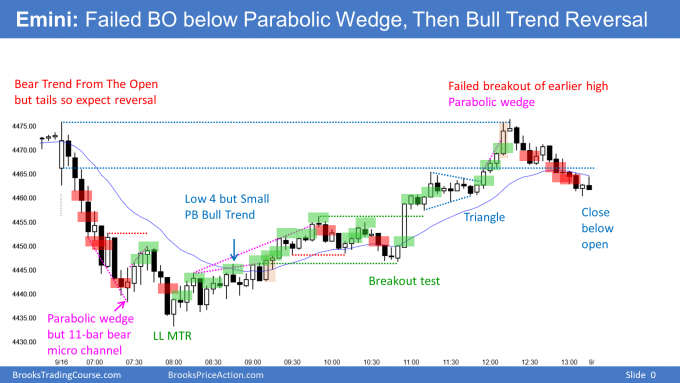
Here are several reasonable stop entry setups from yesterday. I show each buy entry with a green rectangle and each sell entry with a red rectangle. Buyers of both the Brooks Trading Course and Encyclopedia of Chart Patterns have access to a much more detailed explanation of the swing trades for each day (see Online Course/BTC Daily Setups).
My goal with these charts is to present an Always In perspective. If a trader was trying to be Always In or nearly Always In a position all day, and he was not currently in the market, these entries would be logical times for him to enter. These therefore are swing entries.
It is important to understand that most swing setups do not lead to swing trades. As soon as traders are disappointed, many exit. Those who exit prefer to get out with a small profit (scalp), but often have to exit with a small loss.
If the risk is too big for your account, you should wait for trades with less risk or trade an alternative market like the Micro Emini.
EURUSD Forex market trading strategies
EURUSD Forex daily chart

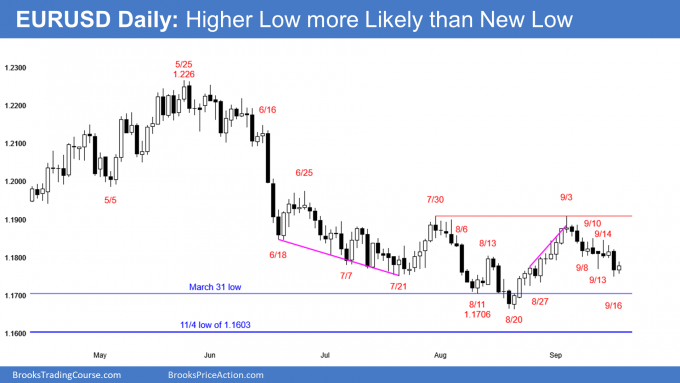
- Yesterday was a big bear day closing in its bottom third, but just 3 pips below the September 13 bull flag attempt.
- This is disappointing for the bears.
- Bears want a bear day today, which would confirm the breakout below Monday’s bull flag. If today is a bear bar closing near its low, the selloff will probably continue down to the August low.
- The bulls are hoping that yesterday was a bear trap. They want it to be a brief stop-run below support. They need a bull bar today to bolster their argument. The conspicuous tail at yesterday’s low increases the chance of a failure.
- Today currently is a small bull day. If today is a bull day closing near it high, it it will be a buy signal bar for a failed bear breakout.
- Also, a reversal up would be from a micro wedge with the September 8 and 13 lows.
So far, the selloff looks more like a leg in a trading range or a pullback from the September 13 rally than a resumption of the May bear trend. - A strong reversal up from here would be from a head and shoulders bottom where the July 21 low is the left shoulder.
- If today is either a small bull or small bear bar, traders will expect at least one or two more sideways days as they decide whether yesterday’s breakout will succeed or fail.
Summary of today’s S&P Emini futures price action and what to expect tomorrow

End of day summary
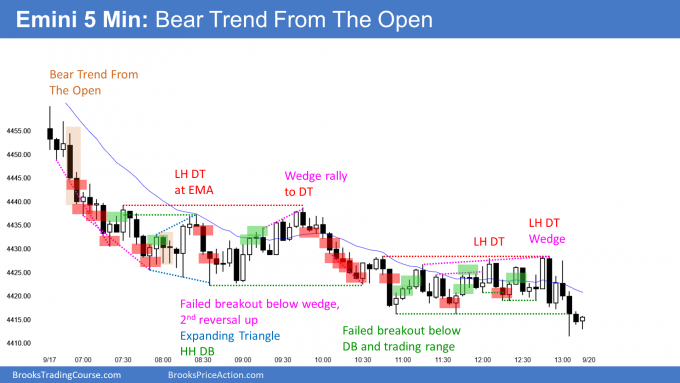
- Bear Trend From The Open with a close near the low of the day and of the week. Increased chance of lower prices next week and of gap down on the weekly chart.
- 5-minute chart sold off exactly to 50-day MA and then entered trading range.
- Broke a little below the trading range and the 50-day MA, but formed another tight range that straddled the 50-day MA.
- Since there is a 50% chance that the September 2 high will be the high of the year, there is a 50% chance that a 15% correction is underway.
- Therefore, there is an increased chance of a big selloff at any time. For example, next week might gap down below the 50-day MA and the bull channel, or the Emini could sell off on Wednesday’s FOMC announcement.
- 50% chance of September 2 being the high of the year means 50% chance there will be a new high. With the Emini at the 50-day, the bulls are hoping for another reversal up, like after every prior test of the 50-day MA since the pandemic crash.
See the weekly update for a discussion of the price action on the weekly chart and for what to expect going into next week.
Trading Room
Traders can see the end of the day bar-by-bar price action report by signing up for free at BrooksPriceAction.com. I talk about the detailed S&P Emini futures price action real-time throughout the day in the BrooksPriceAction.com trading room. We offer a 2 day free trial.
Charts use Pacific Time
When I mention time, it is USA Pacific Time. The Emini day session charts begin at 6:30 am PT and end at 1:15 pm PT which is 15 minutes after the NYSE closes. You can read background information on the market reports on the Market Update page.
Hi Al,
Can you please explain the difference between the Wedge Rally to DT from today that succeeded and the Wedge rally from yesterday where you marked Low 4 but Small PB Bull Trend. In both cases I see Wedges to moving average. The bear trend from yesterday was even stronger than today, yet the wedge from yesterday didn’t succeeded. What makes the difference? Is the big picture from one hour or the daily chart more important than anything on the 5 minutes chart? On the one hour chart there were three pushes up and today was a double top so an expected bear trend? Thank you.
Hi, I’m unable to see the content even after logging in?
The content is locked for Brooks Trading Course members only until 11:30am ET.
Please change your email address as system cannot communicate with the temporary TD365 invalid emails used for registration.