Emini and Forex Trading Update:
Friday September 25, 2020
I will update again at the end of the day.
Pre-Open market analysis
Before yesterday’s open, I talked about the cluster of support at 3200. Support and resistance are magnets that draw the market to them. Yesterday dipped below 3200 and then rallied strongly back to the resistance of the open of the week and the August low.
Remember, I have been saying that September will probably close above the August low. This is because September is an outside down month on the monthly chart in a strong bull trend. The close of an outside bar is usually above the low of the prior month when the bull trend is strong. The Emini might oscillate around that low over the final 4 trading days in September, but it should be above it when the month ends on Wednesday.
I have also been saying that this week should have a bull body on the weekly chart. This is because 4 consecutive bear bars on the weekly chart is rare. The past 3 weeks had bear bodies so this week or next week should have a bull body. The bulls will try to have this week close above the open of the week. With these 2 magnets around yesterday’s high, the Emini might get drawn back up there by the end of the day today.
Yesterday was a weak buy signal bar on the daily chart at support. Therefore, the Emini could rally for a few days. However, there is still a 50% chance of it falling to around 3000 over the next few weeks. That is the bottom of the June trading range, which is a potential Final Bull Flag and a magnet below. Also, the 3000 Big Round Number is a psychological magnet.
Overnight Emini Globex trading
The Emini is down 13 points in the Globex session. With the magnets of the open of the week and last week’s low up near yesterday’s high, the bulls will try to get back up there at some point today. They will therefore look for a reversal up from a double bottom with one of yesterday’s lows.
The bears want lower prices next week. The chance of that will go up if today closes near the low of the day. It would then close below the 20-week EMA and near the magnet of the 100-day MA.
What is most likely? Yesterday had several big reversals. That means there is confusion. Confusion is a hallmark of a trading range. Consequently, there is an increased chance that today will continue yesterday’s trading range price action.
Because today is Friday, day traders will look for a move late in the day to weekly support and resistance. There are many reasons for support around yesterday’s low and 3200. The bears want the week to close below that support. There is resistance around yesterday’s high. At a minimum, the bulls want the week to close above last week’s low.
Yesterday’s setups

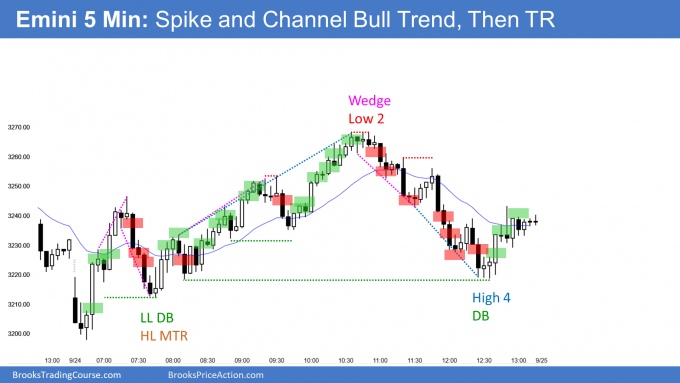
Here are several reasonable stop entry setups from yesterday. I show each buy entry with a green rectangle and each sell entry with a red rectangle. I rarely also show limit order entries and entries on the close of bars. I do not want the lines to be distracting. If they are longer, I make them dotted. But, they have to be visible, so I make the shorter ones solid. Buyers of both the Brooks Trading Course and Encyclopedia of Chart Patterns have access to a much more detailed explanation of the swing trades for each day (see Online Course/BTC Daily Setups).
My goal with these charts is to present an Always In perspective. If a trader was trying to be Always In or nearly Always In a position all day, and he was not currently in the market, these entries would be logical times for him to enter.
If the risk is too big for your account, you should wait for trades with less risk or trade an alternative market like the Micro Emini.
EURUSD Forex market trading strategies

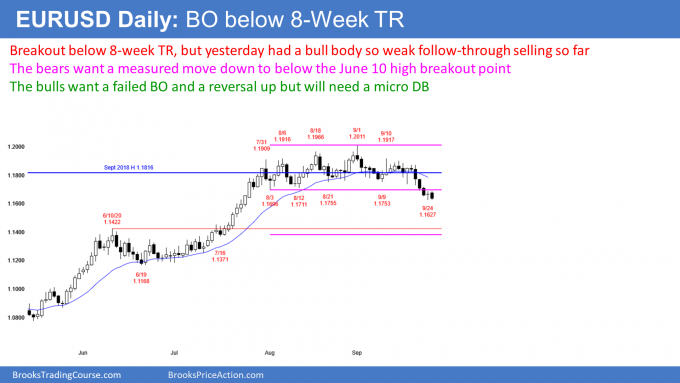
The EURUSD Forex market on the daily chart broke below the 8-week trading range 2 days ago. Yesterday was the follow-through bar. It was a 2nd consecutive close below the trading range, which increases the chance of a measured move down to below the June 10 high. That high is the breakout point and therefore a magnet below.
But yesterday had a bull body. Even though it was tiny, it was a sign of hesitation. It reduces the chance that the selloff will be a trend reversal instead of just a deep pullback in a strong bull trend.
Today so far is a bear bar on the daily chart and it is testing yesterday’s low. The bears want today to close below yesterday’s low and at the low of the week. But if the bulls get a reversal up today, there would be a micro double bottom on the daily chart. That would increase the chance of a 1 – 3-day bounce next week.
It is unlikely that the selloff will go straight down to below the June 10 high. There will probably be attempts to reverse the trend back up. But unless the bulls get some big bull bars and a couple consecutive closes back above the August 3 bottom of the range, traders will sell rallies, expecting lower prices.
Today is Friday and therefore the appearance of the bar on the weekly chart is important. At the moment, this week (not shown) is a big bear bar closing on its low and far below the 8-week tight trading range. If it remains this way, it will increase the chance of lower prices next week.
Overnight EURUSD Forex trading
The 5 minute chart of the EURUSD Forex market reversed down from 2 pips below yesterday’s high overnight. The low so far is just above yesterday’s low. Today is so far an inside bar on the daily chart.
The bears want today to stay at the low of the session. This week would then be a big bear bar on the weekly chart with a close near its low. Traders would expect follow-through selling next week.
The bulls want a reversal back up to the high of the day. Today would then be a micro double bottom with yesterday on the daily chart, which would increase the chance of a bounce next week.
The overnight selloff has been in a tight bear channel so day traders have only been selling. However, the selling is stalling at yesterday’s low. If the bulls can get a 20 – 30 pip bounce, day traders will begin to buy. They would expect either a trading range or a bull trend reversal.
For the bulls to get a reversal up, they will probably need the selloff to transition into a trading range for at least an hour. Usually a bear trend needs to go sideways and form at least a small double bottom before it can reverse into a bull trend.
Summary of today’s S&P Emini futures price action and what to expect tomorrow
I will post chart after the close.

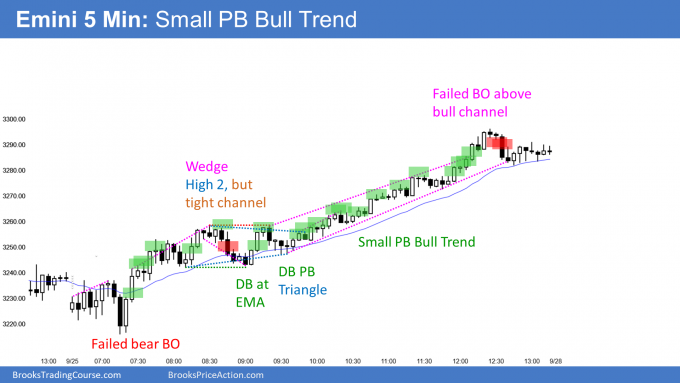
Here are several reasonable stop entry setups for today. I show each buy entry with a green rectangle and each sell entry with a red rectangle. I rarely also show limit order entries and entries on the close of bars. I do not want the lines to be distracting. If they are longer, I make them dotted. But, they have to be visible, so I make the shorter ones solid. Buyers of both the Brooks Trading Course and Encyclopedia of Chart Patterns have access to a much more detailed explanation of the swing trades for each day (see Online Course/BTC Daily Setups).
My goal with these charts is to present an Always In perspective. If a trader was trying to be Always In or nearly Always In a position all day, and he was not currently in the market, these entries would be logical times for him to enter.
If the risk is too big for your account, you should wait for trades with less risk or trade an alternative market like the Micro Emini.
End of day summary
The Emini had an opening reversal up from a higher low from yesterday and rallied in a strong Spike and Channel Bull Trend. As I have been saying was likely for several days, today and this week closed above the open of the week. This week therefore had a bull body on the weekly chart, breaking the streak of 3 consecutive bear weeks. It is a High 2 buy signal bar for next week on the weekly chart.
Since there is a small wedge bottom on the daily chart, the Emini will probably rally for a few days. At a minimum, when the month closes on Wednesday, the close will probably be above the August low. Therefore, there is not much downside risk early next week.
See the weekly update for a discussion of the price action on the weekly chart and for what to expect going into next week.
Trading Room
Traders can see the end of the day bar-by-bar price action report by signing up for free at BrooksPriceAction.com. I talk about the detailed S&P Emini futures price action real-time throughout the day in the BrooksPriceAction.com trading room. We offer a 2 day free trial.
Charts use Pacific Standard Time
When I mention time, it is USA Pacific Standard Time (the Emini day session opens at 6:30 am PST, and closes at 1:15 pm PST). You can read background information on the intraday market reports on the Market Update page.
Al – I can’t thank you enough for your daily mentoring. I find your Daily Setup chart markups particularly helpful. All day long I look for “WWAD” trades (What Would Al Do). After studying you’re work for over a year I’ve gained some confidence in emulating your trading style. On Friday, I saw bars 1-7 as a small wedge PB to the EMA, and bar 8 as a good sell signal bar (a typical WWAD in my mind). I sold below bar 8 and got filled on bar 9 (the bear trap). Through sufficient disappoint as bar 10 was forming I got quick (thank goodness). But anyway, you did not label selling below bar 8 as a reasonable sell on your chart markup. I was wondering if you could elaborate on that decision. Thank you in advance for any additional context you may be willing to offer.