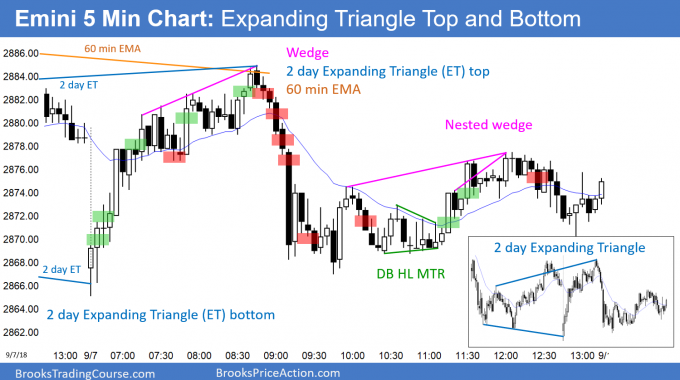
Emini testing bottom of bull channel at around 2860
I will update again at the end of the day.
Pre-Open market analysis
The Emini has sold off without a pullback for 7 days. It is getting vacuumed down to the bottom of the bull channel. There are two bull trend lines. The 1st is just below Friday’s low, and the Emini will probably get there within a week by trading mostly sideways.
While the bulls want a reversal up from that trend line support, they will probably need a micro double bottom. This is because after 7 days without a pullback, the bears will sell above the prior day’s high. As a result, the upside is limited for at least a couple of days.
Can the bears get a strong break below the channel and then a test of the broader bull channel’s bottom around 2820? Of course, but the odds are that there will be at least some buying around the 2860 bottom of the tighter bull channel.
Overnight Emini Globex trading
The Emini is up 8 points in the Globex session. However, after 7 days without a pullback, the odds are that there are sellers above Friday’s high. In addition, the bull trend line below Friday’s low is still a magnet. Consequently, the bulls will probably not be able to hold above Friday’s high for more than a couple of days.
But, 7 days without a pullback is extreme and therefore climactic. Consequently, there is an increased chance of a 1 – 3 day rally. Emini day traders will look for a swing up today, especially if the bulls can break above the 60 minute EMA and the 7 day bear trend line on the 60 minute chart.
Can the bears get a collapse today? Unlikely. However, if there is a strong break below the 7 day bear channel, day traders need to sell. It never matters if something is unlikely if it is happening. Day traders trade what is in front of them, not what they thing should be in front of them.
Friday’s setups

Here are several reasonable stop entry setups from Friday. I sometimes also show limit order entries and entries on the close of bars. My goal with these charts is to present an Always In perspective. If a trader was trying to be Always In or nearly Always In a position all day, and he was not in a position at the moment, these entries would be logical times for him to enter.
EURUSD Forex market trading strategies
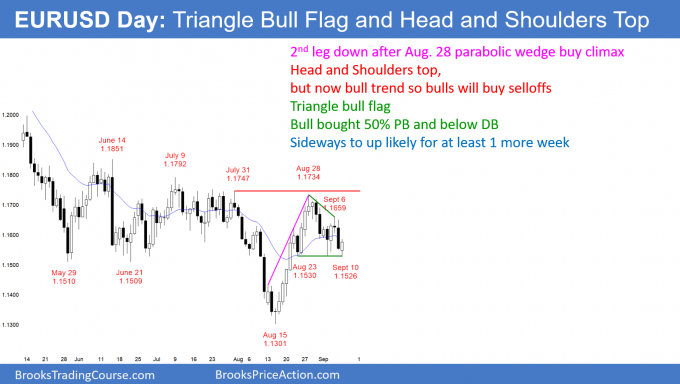
The EURUSD daily Forex chart has a 3 week head and shoulders top. But, that is always also a triangle bull flag. Since the chart had a bull trend reversal in August, the odds favor the bulls.
Last week, I said that the daily chart would have 2 legs down to around the August 23 low and the 20 day EMA after a parabolic wedge rally. The bears achieved their goal overnight.
The bears now have a head and shoulders top over the past 3 weeks. However, only 40% of reversals actually lead to a reversal. Furthermore, every head and shoulders top is also a triangle bull flag. There is a 60% chance of sideways to up trading.
Even if the bears get a few days down below the neck line, the daily chart had a strong bull trend reversal that began on August 15. Therefore, the odds are that the bulls will buy any selloff that reverses up from above that low. The bears need a strong break below that support before traders will believe that the bears have regained control.
The odds favor the bulls over the next several weeks. Since the daily chart is back in a 5 month trading range, it might trade sideways here for many more weeks before breaking above the July 31 top of the final leg down. But, the odds favor the breakout.
Because of the trading range, traders will take profits after ever few days up or down. In addition, when the market is low, like today, they buy. When it is near the top of the range around 1.17, they sell. The result is a continuation of the range.
I wrote about this repeatedly in May and June. Every time there was a strong leg up or down, I said that a reversal was more likely than a breakout. That is again true.
Overnight EURUSD Forex trading
The EURUSD 5 minute chart dipped 4 pips below the 2 week double bottom and then reversed up 60 pips over 3 hours. This is because most traders believe that the head and shoulders top is a minor reversal. They therefore bet against the bear breakout.
The 5 minute chart has been sideways for 3 hours. If the bulls can close the day near its high, today will be a good buy signal bar on the daily chart. There is therefore an increased chance of a resumption of the overnight bull trend this morning.
But, the daily chart is in a trading range. Therefore, the odds constantly favor disappointed bulls and bears. For example, if today closes 20 or more pips below today’s high, the buy signal bar on the daily chart will be weak. The bulls tomorrow will be less willing to buy above today’s high. That could result in a few sideways days around 1.1550. The bears would then try again to break below the 3 week head and shoulders top.
Since the rally stalled over the past 3 hours, there might not be much movement left for the remainder of the day. Also, 1.16 has been both support and resistance over the past 5 days, and it is only 20 pips above.
Summary of today’s S&P Emini futures price action and what to expect tomorrow
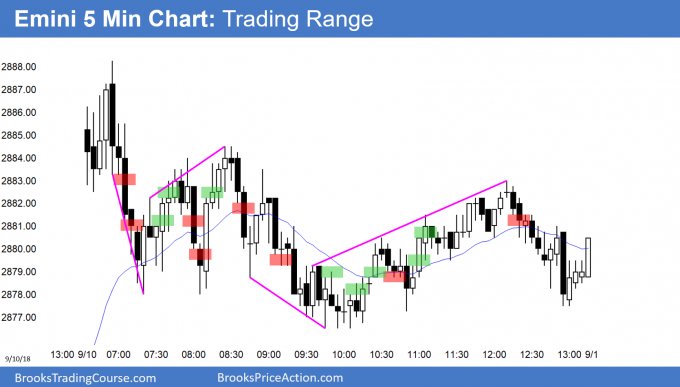
Here are several reasonable stop entry setups for today. I sometimes also show limit order entries and entries on the close of bars. My goal with these charts is to present an Always In perspective. If a trader was trying to be Always In or nearly Always In a position all day, and he was not in a position at the moment, these entries would be logical times for him to enter.
Today was the 1st breakout above a 7 day bear micro channel. As expected, there were sellers above Friday’s high. But, the selloff was not strong and today was a trading range day. The bulls might get a 2nd day above the micro channel, but the odds favor a test of the bull trend line on the daily chart, which is now around Friday’s low. The Emini can get there by going sideways or down this week.
Since today was a failed breakout above the 7 day bear micro channel, it is a sell signal bar for tomorrow. However, there will probably be buyers around the bull trend line, which is around Friday’s low.
Last week was a bear bar on the weekly chart after a 6 bar bull micro channel. It is therefore a sell signal bar for this week. But, the bull channel on the weekly chart is tight. Therefore, this is a minor sell setup.
See the weekly update for a discussion of the price action on the weekly candlestick chart and for what to expect going into next week.
Traders can see the end of the day bar-by-bar price action report by signing up for free at BrooksPriceAction.com. I talk about the detailed S&P Emini futures price action real-time throughout the day in the BrooksPriceAction.com trading room. We offer a 2 day free trial.
When I mention time, it is USA Pacific Standard Time (the Emini day session opens at 6:30 am PST, and closes at 1:15 pm PST). You can read background information on the intraday market reports on the Intraday Market Update page.


Hi Al, I bought about #20 for swing and stop below #19, and I hold through the bear leg from #24 to #34 and was eventually stopped out below #19. I saw the bear leg was weak though, and I was debating whether I should use wider stop which probably means I have to move it below yesterday’s #77, or whether I should just let it be hit and then buy again if the breakout to the downside fails…
So as a general rule, what is the right thing to do for swing trading this? At the time I was struggling to made a decision between:
1) either don’t change initial stop, hold through the PB, if the stop is hit then let it be hit. Then by the reversal up like #39 or #43;
2) or get out when it is clearly always in short. Which probably means use wider stop like below yesterday’s #77. (I thought in the bear leg #24 – #41 the market never become always in short.)
My general approach is to exit whenever I think my premise is no longer valid. In this case, if I were long, I would get out below a bear bar closing near its low, especially if there were consecutive bear bars, like below 25 or 26.
The weak follow-through on 21, 23, and 24 made the rally look like it might be a bull leg in a trading range. Then, when the bodies of 23 and 24 failed to overlap the body of 6, the bears had a body gap. This is not good for the bulls, and they should look to exit longs.
Most days are mostly trading range days. In general, it is better to look to exit quickly unless the day becomes a clear trend day.
When I bought above #21 my premise is that the day probably won’t be a big bear trend day, after 4 consecutive bull bars (even though they are weak as you pointed out), I “enhanced” my premise that the best the bears can get today will probably a TR day, so after #24, 25, I thought I can scale in lower and eventually make a profit (I didn’t do that because I was debating with myself..), but if I see 3 good consecutive bear bars breaking out below, it will probably transition into a bear trend, and if that happens I will get out and simply accept the loss.
I understand people probably will have different premise about the market when looking at the exact same chart, but do you think my above premise is one of those “reasonable” premise? or it is one of those “dangerous” premise that I should avoid?
BTW I always find it difficult to re-enter if I exit too quickly, and I end up seeing it went a long way without me… Any suggestions?
Hi Coria,
Sorry to say that it is not really practical for Al to answer such detailed questions here. Al’s goal in answering comments is to clarify something that he did not make clear.
As much as Al would like to answer all questions, with thousands of traders using the course, he is simply unable to do that at this point. Other traders can step in to help with comments too, but this is not a forum style and comments are not easy to follow up.
Comments should be limited to either what you think might be a mistake in Al’s post, or to a specific point in the post that is unclear.
Thanks for your understanding.
Hi Coria,
To answer your question about getting back into market you just need to compose yourself. Take some deep breaths, and analyze/review the situation to see if trade setup is valid. Do not trade again until you are calm and relaxed.
The same relaxation logic applies to you NOT getting out of trade too quickly. Keep yourself calm while in a trade and do not allow your emotions to step in and take you out too early. Do not worry about losing trades. Plenty more to come.
Hi Richard, that is very well said: “Do not trade again until you are calm and relaxed”! Very good point!
Al, thanks for identifying the key context and the tells.
One might refer to the afternoon price action as an INSIDE MOVE, an extended version of an INSIDE BAR, what it should look like on a higher TF chart.
As I had differentiated a Small Pullback Bull Trend from a Wedge, once I saw the negative gaps I thought that the strongest form of trend was in place, and ended up exiting flat, on a complacent stop off the 11h30 PST MIN30 bar.
Hi Al,
Because of the negative gaps in the pullbacks following the first two uplegs in the afternoon, I read the move as a small pullback bull trend, and so thought the move ended abruptly, for that classification.
On your chart I think you’re implying it’s a wedge b/c of line you added.
The pullback following the 3rd leg up has a close that fills a negative gap, but not by much, so it does suggest that the move was getting weaker.
Do you see the uplegs/pullbacks 1 & 2 as implying a small pullback bull trend, and if so do you think the move morphed into a wedge in the pullback after the 3rd leg, or do you see the move as a wedge from the start ?
(because the negative gaps have too much overlap, and the ascent is too angled, for this to be a small pullback bull trend ?)
Even if the afternoon uptrend was a small pullback bull trend, would you have expected it to end when it did, simply because afternoon trends typically don’t last much longer than this one did ?
Regards, Charles
Most Small Pullback Bull Trends are tight bull channel wedges and all tight bull channel wedges are Small Pullback Bull Trends. However, the context usually tells traders if the trend is more likely a leg in a trading range or the start of a bull trend.
Until there is a clear, strong breakout with follow-through, the odds always favor a leg in a trading range. I also pay attention to body gaps. The bear breakout began as bar 7 fell below 6. The bodies of 23 and 34 did not extend above the bottom of the body of bar 6. That is not good for the bulls.
The afternoon rally was similar. It was a Small Pullback Bull Trend that was probably a bull leg in a trading range. However, traders never know which new high will be the final one. Some traders sell and get stopped out, then sell again. Others sell, and sell more above the top of the swing, correctly betting that the final top is not too much higher.
Everyone wants an easy trade that goes a long way. When a day is a trading range like this, the bulls and bears are going to be constantly disappointed. I usually scalp almost every trade unless a clear, strong trend develops.