Posted 6:45 a.m.
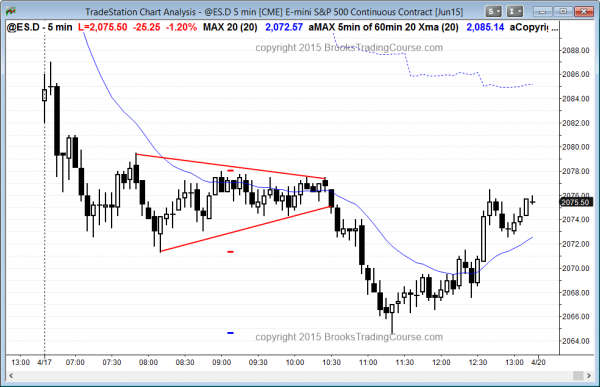
The Emini sold off strongly on the open and is always in short, but the first 2 bars were dojis and the 3rd bar was a sell climax. The Emini is far from its moving average. This is probably an early sell climax and it will probably lead to a trading range for at least an hour. It is probably better for bears to look to sell a pullback closer to the moving average. Bulls need a strong reversal up or a 2nd entry buy. The odds are that the Emini will reverse sideways to up soon and enter a trading range. However, it probably still has more to go in its pullback on the 60 minute chart and traders will look to sell rallies to resistance until there is a strong reversal up. Since a trading range is likely, day traders will scalp part or all of their positions until the trend clearly develops.
My thoughts before the open: Day trading strategies for a wedge top
I mentioned in the trading room yesterday and in my blog that although the rally of the past week was strong, it did not break out above the trading range on the daily chart, and it was a wedge on the 60 minute chart. Traders had to decide if the wedge was complete, or if there was going to be one more small push up. Today’s likely gap down shows that they decided that the wedge top is complete. The day trading tip is to look for a 2 legged pullback on the 60 minute chart that will test near the bottom of the 60 minute channel in the 2065 to 2075 area.
When there is a big gap down, the Emini futures price is far below the moving average. This often limits the downside for the first hour until the Emini gets closer to the moving average. This means that there is often a trading range for an hour or so, and daytraders will be more inclined to be scalp trading than swing trading. The purpose of the trading range, as is always the case, is to create both candlestick patterns for bulls and for bears. At that point, the intraday trading techniques is to look for a candlestick pattern, like a double top or bottom, and enter for a swing trade. Alternatively, daytraders can wait for the breakout in either direction. If it is strong, entering after the breakout has a higher probability of profit, but the stop is further away and the risk is therefore greater.
Traders learning how to trade the market should realize that the correction often enters a trading range about half way down, which is in the 2080 to 2085 area. It is then about equally distant from the top and bottom of the channel, but the probability favors a 2nd leg down. If the bulls can make the trading range grow to 20 or more bars, the odds for the reversal up become about the same as for the resumption down for the 2nd leg.
This is a candlestick pattern on the 60 minute chart that favors lower prices for a day or two. This means that online daytraders who are trading the 5 minute chart will look for reasons to sell. The gap down today might be the end of the first leg down. If so, the Emini S&P will then go sideways to up, pulling back from the first leg down, before it then has its 2nd leg down. That pullback can be a strong bull trend on the 5 minute chart, even though it would be a bear flag on the 60 minute chart. This means that there is a chance that the gap down can lead to a reversal up, and daytraders should not assume that today has to be a bear trend day.
Today is a Friday so weekly support and resistance can be magnets, especially late in the day. Last week’s high was 2097 and last week’s close was 2 ticks lower. This week’s current low is 2075.75
I also mentioned in the price action room yesterday that yesterday was the entry bar for a wedge lower high on the daily chart. Although it was a terrible bar for the bulls since it closed above its midpoint, it did not rally above the high of the prior day, which was the signal bar, and therefore the short was still in effect.
Traders learning how to trade Forex price action know that the dollar has been very strong, but the rally against other currencies has been climactic. The best Forex strategy near term is to look for more trading range price action on the daily chart.
Summary of today’s price action and what to expect tomorrow
The S&P Emini futures gapped down and then entered a triangle. The bears got trend resumption down to the bottom of the 60 minute channel where buyers came in and reversed the Emini futures back to the apex of the triangle.
Although the S&P Emini futures contract today was down 1%, it was also just a test of the bottom of the 60 minute bull trend channel. The market usually bounces and then enters a trading range. At the moment, that is the most likely outcome over the next day or two.
See the weekly update for a discussion of the weekly chart and for what to expect going into next week.
Traders can see the end of the day bar-by-bar price action report by signing up for free at BrooksPriceAction.com. I talk about the detailed Emini price action real-time throughout the day in the BrooksPriceAction.com trading room, and a 2 day free trial is available.
When I mention time, it is USA Pacific Standard Time (the Emini day session opens at 6:30 am PST, and closes at 1:15 pm PST). You can read background information on the intraday market reports on the Intraday Market Update page.
