Posted 6:45 a.m.
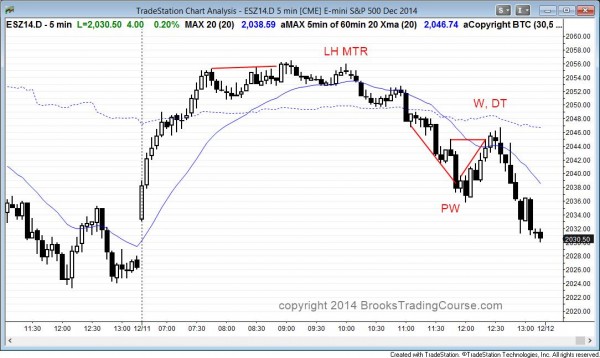
The Emini began with a strong bull trend and formed a trend from the open bull trend. It is always in long. The rally is strong enough to make a bear trend day unlikely. However, the day could become a trading range day. If so, the Emini will then make a choice late in the day between trend resumption up and trend reversal down.
Although it is possible that this initial rally will form a buy climax and the high of the day, the odds of that are small without first forming a trading range or a parabolic wedge. It rallied 12 points above the open. If this becomes a bear trend day, it would then have a 12 point tail on the top of the bar, which would be very unusual. The odds favor a bull trend day, but a trading range is likely soon because this initial rally is climactic.
Here are my thoughts before the open. Monday was a bull channel and therefore a bear flag, and yesterday was a bear channel and therefore a bull flag. Even though this selloff might be the start of a test down to the gap at 1988.25, there will always be bull days during any selloff.
A bear channel, like yesterday’s, usually tries to have a bull breakout and a rally that lasts at least a couple of hours. The selling was strong enough so that there may be some additional selling during the first hour or two, but there is at least a 60% chance that the Emini will try to trigger a major trend reversal at some point in the first couple of hours. Most result in big trading ranges, but there will probably be a profitable swing up, whether or not the day then sells off.
Day trading outlook for tomorrow’s Emini price action

The Emini had a climactic rally on the open and then a major trend reversal. There was a parabolic wedge bottom. This was followed by a double top and wedge bear flag that led to a new low of the day
The opening rally was a buy climax. When this happens, the Emini usually goes sideways for a couple of hours and then decides between trend resumption up and trend reversal down. It reversed down, but in a parabolic wedge. There was a strong rally that failed at a double top and a wedge bear flag, and this led to a new low of the day.

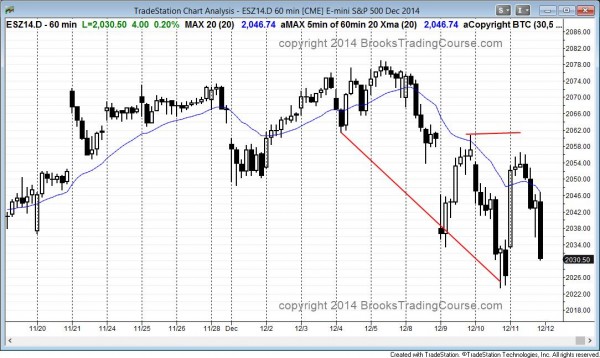
The 60 minute chart reversed up yesterday after a 5 day wedge bull flag.
The odds were that there be a 2nd leg up after today’s pullback. However, today’s selling was so strong that there is now the possibility of a double top bear flag, and then a bear breakout below the wedge bottom. The target would be a measured move down, which would be below the September high (the breakout point on the daily chart), below 2,000, and possibly below the October 31 gap.. The bulls are still hoping for a 2nd leg up after the wedge bottom. Since the 60 minute chart is in a trading range, the probability is the same for the bulls and bears. The higher time frames are in bull trends, but overbought, and this does not alter the probability.
Premarket price action analysis
See yesterday’s intraday market update report for today’s premarket analysis. Once there, scroll down to the heading, Day trading outlook for tomorrow’s Emini price action.
See the weekly update for a discussion of the weekly chart and for what to expect going into next week.
Traders can see the end of the day bar-by-bar price action report by signing up for free at BrooksPriceAction.com. I talk about the detailed Emini price action real-time throughout the day in the BrooksPriceAction.com trading room, and a 2 day free trial is available.
When I mention time, it is USA Pacific Standard Time (the Emini day session opens at 6:30 am PST, and closes at 1:15 pm PST). You can read background information on the intraday market reports on the Intraday Market Update page.