Emini weak breakout above 7 day bear micro channel
I will update again at the end of the day.
Pre-Open market analysis
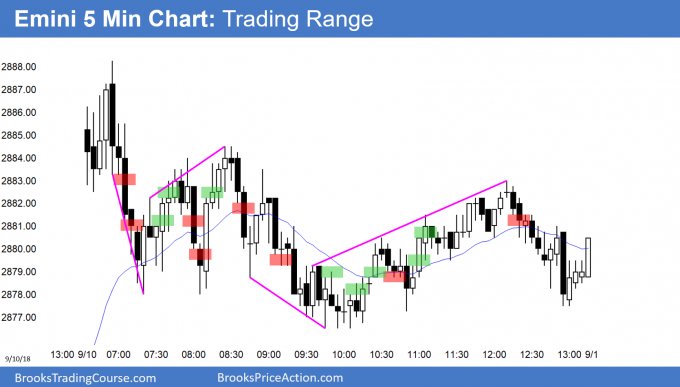
Yesterday was the 1st day in 7 days that traded above the prior day’s high. A 7 bar bear micro channel is a sign of strong bears. Therefore, there were more likely going to be more sellers than buyers above Friday’s high. The result was a failed breakout above Friday’s high on the open. Yesterday is a sell signal bar for today.
Furthermore, the Emini should test the bull trend line below last week’s low. It can get there by going sideways or down. Even if today trades above yesterday’s high, the magnet of the bottom of the channel is strong. Most bulls will not buy until that bull trend line has been touched, or unless there is a strong rally from here. The bulls want to see a strong reversal up from that support.
If instead the Emini simply rallies strongly this week without touching the line, traders will conclude that Friday’s test was good enough. More likely, the Emini will need to touch that line.
Minor sell signal on the weekly chart
There is a 6 week parabolic wedge top on the weekly chart. This is a small pattern and therefore minor. The bears want it to be a failed breakout above the January high. Last week was a bear bar and therefore a 2 bar reversal with the prior week. It is a sell signal bar for this minor top.
Since there is a bull trend line on the daily chart around last week’s low, the Emini will probably trade below last week’s low in its test of that trend line. That would trigger the weekly sell signal.
Every selloff since the January high ended after 1 – 3 weeks. This includes the huge February collapse. Traders will therefore expect the same this time, and look for a reversal back up within 2 – 3 weeks.
Can a minor top like this lead to a major trend reversal? Here, a bear trend and a break below the February low. In general, there is a 20% chance. The odds go up if the bears begin to get consecutive big bear bars on the weekly chart. Also, if there is a strong minor reversal and then a failed attempt to resume the bull trend, there would then be a major trend reversal sell setup.
Overnight Emini Globex trading
The Emini is down 8 points in the Globex session. It will therefore gap down on the open. Since last week’s low and the daily bull trend line are just below, the Emini should trade lower this week. There is therefore an increased chance of a bear trend day today. However, most days over the past 2 weeks have had mostly trading range trading. Therefore, even if today sells off, the odds are against a strong bear trend.
Yesterday’s setups
Here are several reasonable stop entry setups from yesterday. I sometimes also show limit order entries and entries on the close of bars. My goal with these charts is to present an Always In perspective. If a trader was trying to be Always In or nearly Always In a position all day, and he was not in a position at the moment, these entries would be logical times for him to enter.
EURUSD Forex head and shoulders top and triangle bull flag so Breakout Mode
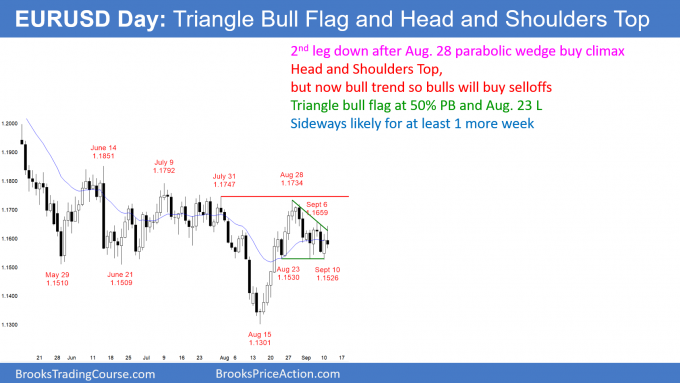
The EURUSD daily Forex chart has been in a trading range for 3 weeks. There is therefore both a buy setup and a sell setup. The bears have a head and shoulders top and the bulls have a triangle bull flag.
The EURUSD daily Forex chart is in a 3 week triangle and therefore in Breakout Mode. Furthermore, that triangle is in a 5 month trading range. Since there is no sign of an impending breakout, traders will take profits after 2 – 5 days and look for reversals.
The August reversal was strong and the weekly chart is probably having a 7 month pullback in a bull trend. Consequently, the odds ultimately favor a bull breakout. But, until there is a breakout, there is no breakout. Traders will expect every strong 3 – 5 day move up or down to reverse.
3 week Triangle means Breakout Mode
While the bulls have a triangle bull flag, triangles are not high probability setups. The initial breakout up or down reverses 50% of the time. In addition, the successful breakout has almost an equal chance of being up or down. There is therefore a 50% chance of a break below 1.15 before a test of the 1.1750 top of the 5 month range. However, there will probably be buyers above 1.14.
Overnight EURUSD Forex trading
The EURUSD 5 minute Forex chart sold off 80 pips overnight after a rally for a day and a half. Big Up, Big Down creates Big Confusion. Therefore, the selloff will probably disappoint the bears, just like reversal down from the the rally disappointed the bulls. Today will probably be a trading range day in the middle of a 7 day tight trading range.
Summary of today’s S&P Emini futures price action and what to expect tomorrow
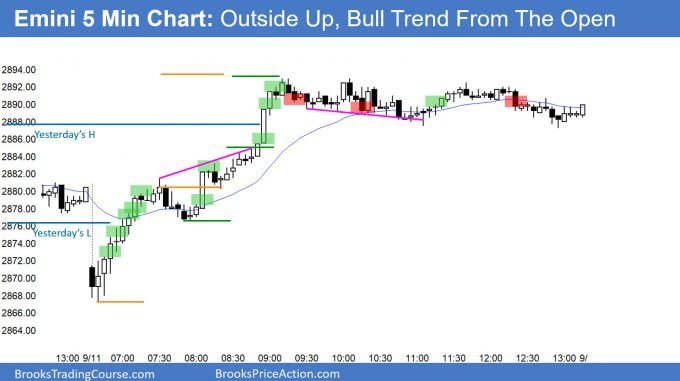
Here are several reasonable stop entry setups for today. I sometimes also show limit order entries and entries on the close of bars. My goal with these charts is to present an Always In perspective. If a trader was trying to be Always In or nearly Always In a position all day, and he was not in a position at the moment, these entries would be logical times for him to enter.
The Emini reversed up from below yesterday’s low and broke above yesterday’s high. It therefore was an outside up day, which is a sign of strong bulls. It also formed a micro double bottom with Friday’s low.
However, it is in a 4 day tight trading range. Furthermore, it has not yet pulled back to the bull trend line, which is now around yesterday’s low. Therefore, unless there is strong follow-through buying this week, the odds will continue to favor a test of that bull trend line before the bull trend resumes.
See the weekly update for a discussion of the price action on the weekly candlestick chart and for what to expect going into next week.
Traders can see the end of the day bar-by-bar price action report by signing up for free at BrooksPriceAction.com. I talk about the detailed S&P Emini futures price action real-time throughout the day in the BrooksPriceAction.com trading room. We offer a 2 day free trial.
When I mention time, it is USA Pacific Standard Time (the Emini day session opens at 6:30 am PST, and closes at 1:15 pm PST). You can read background information on the intraday market reports on the Intraday Market Update page.


Question about the buy above the 6:40 bar. That bar seems to be a breakout bar from a trendline drawn from 5:00 a.m. Is there any value in paying attention to that type of activity from the Globex session, or do you just look at the 6:35 and 6:40 reversing up strongly from an apparent test of the Friday low, and base the buy on that price action ? thx
I ignore the Globex support and resistance, even though it is important. Many other things on other charts are important as well, and I ignore them, too. All I am interested in is the chart in front of me. There are 81 bars in the day session and I see about 50 reasonable trades a day. I don’t need to see more. If I look at other things, I tend to get distracted from what is most important, which is the chart I am trading. I don’t believe I can make more money by adding variables. I do believe I can make more money by trading the chart in front of me better, and that should be ever trader’s goal.
Al,
Looking at the ES chart with overnight data included shows a perfect touch of the bull trend line. Is it possible traders/computers are satisfied with this test?
Thanks.
Dave
Different computers look at different things. Those that are looking at the day session know that the odds favor a test, even if the Globex chart might have already touched the line. On my computer, the pullback on the 24 hour daily and 60 minute Globex charts also did not quite get to the line.