Emini wedge bear flag after FOMC minutes
Updated 6:59 a.m.
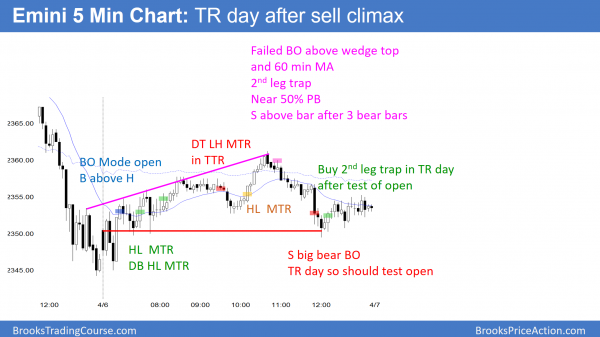
The bears got an opening reversal down from the moving average. Yet, they need follow-through selling if today is going to be a strong bear day. More likely, today will begin with a trading range. If there is a selloff, it will probably reverse up from a Final Bear Flag reversal within an hour.
Yesterday was a big outside down day. Yet, it was in a 3 week trading range. That therefore increases the chances of a continued trading range on the daily chart. Furthermore, it increases the chances of an inside day today. At the moment, the Emini tested yesterday’s low, but reversed up. This is a possible low of the day.
The Emini is Always In Long and trying to break above the trading range. Even if it is successful, any rally will probably be part of a big trading range. This is because the bulls will probably need a major trend reversal. Hence, there will probably be a test down within a couple of hours. At the moment, today will probably be sideways, but the bulls are trying for an early swing up to the 60 minute moving average.
The bears might try for trend resumption down at the end of the day.
Pre-Open market analysis
The Emini sold of from a 10 day wedge rally on the 60 minute chart yesterday and closed near the low. Consequently, yesterday is a sell signal bar for a wedge lower high on the daily chart. Yet, yesterday also triggered a buy signal on the weekly chart by going above last week’s high. As I posted on the weekend, the odds were that the weekly bull flag would fail.
While the reversal down was good for the bears, the bulls still might get a test of the March 15 lower high before the bear trend on the daily chart resumes. The bulls need a strong breakout above that high to make the bears give up.
There is an extreme buy climax on the weekly chart. In addition, the reversal down was at a measured move up from a 2 year trading range. Finally, the Emini never tested last year’s close. Consequently, the odds are that the Emini is in the early stage of a 5% correction.
Sell climaxes often options related
Most stock is held by institutions. They protect their portfolios by buying puts. When the stock market begins to sell off, the institutions that sell puts are then holding losing positions. The nature of options makes the value of puts increase parabolically during a selloff (the gamma increases). Hence, option sellers have losses that accelerate quickly. Consequently, they have to hedge their short put positions.
Since the easiest way to do it is by selling stocks and stock index futures, their hedging increases the selling. Hence, the market can collapse in a series of sell climaxes, like yesterday.
While a sell climax is underway, it is impossible to know how much was due to traders being bearish and how much was due to hedging. If most was due to bears, there is usually follow-through selling over the next few days. If there is no follow-through selling, then sometimes as much as 50% of a selloff can simply be due to hedging and not bearish sentiment. As a result, sell climaxes, like the one on March 21, often lead to reversals.
We therefore will find out over the next few days if yesterday was the start of bearish sentiment or simply options related hedging in a trading range or bull trend.
Overnight Emini Globex trading
The Emini is up 4 points in the Globex market. This means that much of yesterday’s selling was probably options related. Hence, it increases the chances of at least a couple legs sideways to up today. While there is a 50% chance of some follow-through selling in the 1st 2 hours, there is a 75% chance of at least a 2 hour trading range that begins by the end of the 2nd hour.
The best case for the bears would be a big gap down followed by a big bear trend day. A big gap down is unlikely. Yet, there is still a 25% chance of a big bear trend day.
EURUSD Forex market trading strategies
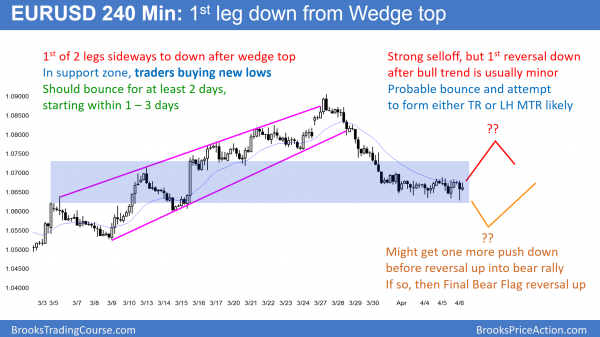
Traders continue to buy new lows, as they have been doing for 5 days. Bulls see an expanding triangle bottom on the 240 minute chart. Bears see a bear flag.
The EURUSD Forex market has been sideways for 5 days. Bulls are beginning to buy at the prior low for scalps. In addition, bears are using new lows to take profits. Consequently, they are losing conviction in the bear trend. Hence, the EURUSD 240 minute Forex chart is in breakout mode. The probability of a bear breakout has fallen to almost the same as for a bull reversal.
Because the selling has been climactic, the downside risk near-term is less. If there is a bear breakout, it will probably fail and reverse up. This 5 day trading range will then probably be the Final Bear Flag before a 2 legged, 150 pip rally.
Bear rally?
The bulls see this trading range as a base that contains a major trend reversal. If they create a bull breakout over the next few days, the rally will probably have 2 legs up. In addition, it will probably reach a measured move up. Since the range is about 60 pips tall, the minimum target would be about 120 pips above the bottom of the range.
Furthermore, the resistance caused by prior major highs and lows above is a magnet. Moreover, reversals often correct about 50% of the selling. Finally, the 240 minute chart is still in a 5 month trading range, and most breakout attempts fail. This is true even when they are strong, like this one.
Overnight EURUSD Forex trading
The 5 day tight trading range continued overnight. Hence, day traders are still mostly scalping. Yet, the odds favor a breakout up or down within a few days. If there is a bear breakout, the odds are that it will reverse. Swing traders who sell the breakout have to be quick to make decisions because of the probability of a reversal. If there is a strong bull breakout, or a bear breakout and a reversal up, it will probably last at least a week. In addition, it will probably rally 100 – 150 pips above the low. Finally, it will likely have at least 2 legs.
Summary of today’s S&P Emini futures price action and what to expect tomorrow
After yesterday’s sell climax, today was an inside day and a trading range day. The rally failed at the 60 minute moving average and a 50% of yesterday’s selloff. The selloff at the end was just a test of the open of the day.
Today was an inside day after yesterday’s sell climax. Hence, the bears see it as a pullback from yesterday’s selloff. They therefore will sell below. The bulls see it as a failed breakout and therefore will buy above. It is just a trading range day in the middle of a 2 month trading range.
While the bulls still might get a test of the March 15 lower high, the odds are that the Emini is in the early stages of a bear trend down to the December close.
See the weekly update for a discussion of the price action on the weekly candlestick chart and for what to expect going into next week.
Traders can see the end of the day bar-by-bar price action report by signing up for free at BrooksPriceAction.com. I talk about the detailed S&P Emini futures price action real-time throughout the day in the BrooksPriceAction.com trading room. We offer a 2 day free trial.
When I mention time, it is USA Pacific Standard Time (the Emini day session opens at 6:30 am PST, and closes at 1:15 pm PST). You can read background information on the intraday market reports on the Intraday Market Update page.


with the mDT on the 60m yesterday, should we expect TBTL down on the 60m?
The micro double top is not a strong reason to expect 2 legs down. However, yesterday’s selloff was strong enough so that the odds are, bears will sell again at around a 50% pullback for a test back down.
Even though yesterday was a micro double bottom on the daily chart with the April 3 low, the selloff was strong enough so that the 1st reversal up will probably not get too far before there is a test down. The 2 month trading range will probably continue.