Emini and Forex Trading Update:
Monday August 12, 2019
I will update again at the end of the day.
Pre-Open market analysis
On the weekly chart, last week was a bull bar and a possible end of a 2 week pullback. It is a buy signal bar for this week. The weekly chart is in a bull trend and the 2 week selloff formed a higher low.
This week will probably go above last week’s high at some point and trigger the buy signal. However, since early July, I have been saying that the minimum selloff would be 2 – 3 weeks. This 2 week selloff was exceptionally strong. Consequently, the weekly chart will probably be mostly sideways for another week or two. In addition, last week’s low might not be the bottom of the pullback. This is despite the weekly buy signal bar.
Friday was a bear doji bar on the daily chart. The Emini is in the middle of the 2 week selloff. A doji is neutral. There will probably be buyers not far below its low and sellers not far above its high. Traders will be cautious this week after Big Up in July, and Big Down and Up in August. The Emini will probably be mostly sideways for at least a few days.
Overnight Emini Globex trading
The Emini is down 18 points in the Globex session. It will probably gap down below Friday’s close. Furthermore, it might even gap below Friday’s low, the 60 minute EMA, and the 2900 Big Round Number. Those support levels will be magnets today.
Traders are deciding if last week’s low is the end of the selloff. While the odds favor at least another couple weeks of sideways to down trading before the bull trend resumes, there is currently only about a 50% chance of a break below last week’s low.
A big gap below Friday’s close will confuse traders. This is consistent with what I have been saying. The bulls will be disappointed, just as the bears were disappointed by the 2 big bull days last week. Disappointment makes traders unwilling to hold onto positions. This typically results in a trading range. A trading range on the daily chart usually has a lot of trading range price action on the 5 minute chart.
But, the daily ranges have been big. Consequently, the legs up and down will likely allow day traders to continue to swing trade up and down for 2 or more hours at a time.
Friday’s setups

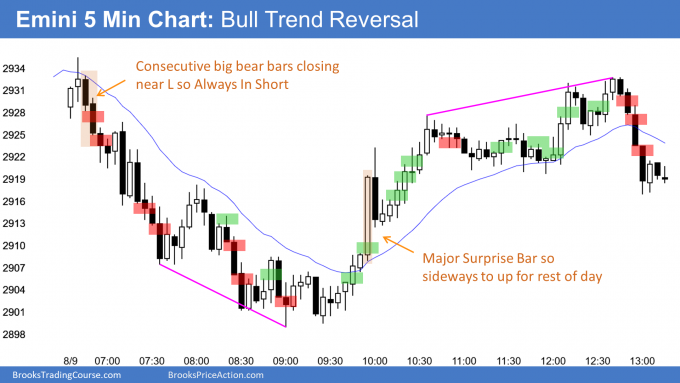
Here are several reasonable stop entry setups from Friday. I show each buy entry with a green rectangle and each sell entry with a red rectangle. I rarely also show limit order entries and entries on the close of bars. Buyers of the Brooks Trading Course and Encyclopedia of Chart Patterns have access to a much more detailed explanation of the swing trades for each day.
My goal with these charts is to present an Always In perspective. If a trader was trying to be Always In or nearly Always In a position all day, and he was not currently in the market, these entries would be logical times for him to enter.
EURUSD Forex market trading strategies

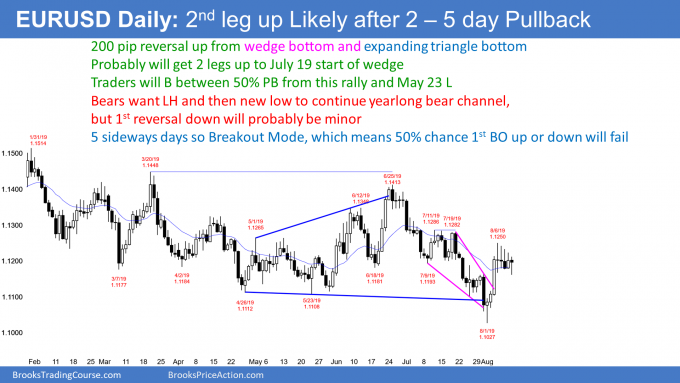
Today is the 5th day in a tight trading range on the EURUSD daily Forex chart. This is a Breakout Mode pattern. That means that there is about a 50% chance of a successful bull breakout or a bear breakout. Traders see it as either a triangle bull flag or a triangle top in a bear rally in a bear channel.
When there is a Breakout Mode pattern, traders expect the 1st breakout up or down to fail. Furthermore, until there is a clear breakout, there is no breakout.
Overnight EURUSD Forex trading
Today broke below the 4 day range but reversed up and it is forming a 5th day in the tight range. This is a failed bear breakout and it increases the chance of a successful bull breakout tomorrow or Wednesday’s.
The bulls are hoping that today will close near its high. Today might even be an outside up day (break above Friday’s high after breaking below its low). If today closes near its high, today will increase the chance of a successful bull breakout tomorrow.
If it instead closes near its low, traders will conclude that the daily chart will begin to test down to the August 1 high.
The overnight 40 pip reversal up from below Friday’s low was mostly in a tight bull channel. That means that the rest of the day will probably be sideways to up.
However, the rally pulled back an hour ago. In addition, it is now getting close to the Friday’s high. Today is the 4th consecutive day with slightly lower highs. The bears are hoping to stop the rally and convert the day into a trading range. At the moment, it is unlikely that they will get more than a 30 pip reversal down today.
Because the rally is at the resistance of the top of the 5 day range, it will likely not go much higher today. With limited upside and downside, the 5 minute chart will probably begin to enter a 30 pip trading range.
Summary of today’s S&P Emini futures price action and what to expect tomorrow

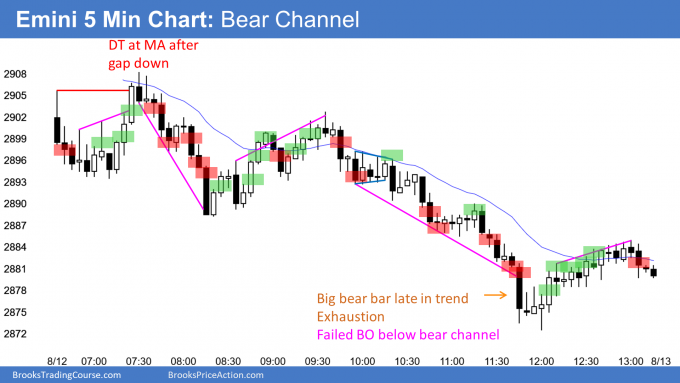
Here are several reasonable stop entry setups for today. I show each buy entry with a green rectangle and each sell entry with a red rectangle. I rarely also show limit order entries and entries on the close of bars. Buyers of the Brooks Trading Course and Encyclopedia of Chart Patterns have access to a much more detailed explanation of the swing trades for each day.
My goal with these charts is to present an Always In perspective. If a trader was trying to be Always In or nearly Always In a position all day, and he was not currently in the market, these entries would be logical times for him to enter.
End of day summary
The Emini fell below Friday’s low and triggered a sell signal on the daily chart today. However, Friday was a bear doji and therefore a weak sell signal bar. Also, the context is bad for the bears. Last week had 2 big bull bars.
While today sold off in a broad bear channel, the selloff held above last week’s low. It is still more likely that the 2 day pullback is a pullback from last week’s strong reversal up. But it is also likely that the Emini will be mostly sideways for the next couple of weeks after Big Up in July, and Big Down and Up and now Down in August.
See the weekly update for a discussion of the price action on the weekly chart and for what to expect going into next week.
Trading Room
Traders can see the end of the day bar-by-bar price action report by signing up for free at BrooksPriceAction.com. I talk about the detailed S&P Emini futures price action real-time throughout the day in the BrooksPriceAction.com trading room. We offer a 2 day free trial.
Charts use Pacific Standard Time
When I mention time, it is USA Pacific Standard Time (the Emini day session opens at 6:30 am PST, and closes at 1:15 pm PST). You can read background information on the intraday market reports on the Intraday Market Update page.