Learn to trade trading range breakouts
Updated 7:05 a.m.
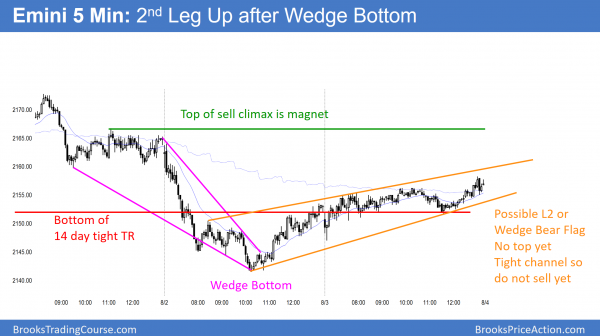
Today opened with a bear breakout below yesterday’s bull channel. Yet, the Emini reversed up from an Opening Reversal. The follow-through stalled at the top of yesterday’s rally. It then turned down in an attempt at an Opening Reversal down. When there are both credible top and bottom setups and neither looks good, the odds are that the market will go sideways. This is a limit order open. While it can become a trend up or down, it increases the chances of a lot of trading range price action today.
The bulls want to reverse yesterday’s selloff. Yet, the odds are against a rally up to yesterday’s high. The bears want a 2nd leg down after 2 days down. However, yesterday reversed up at the daily moving average. Today will probably be like most days over the past 3 weeks. They have bad swings up and down, but spent most of the time in a trading range.
If there is a strong breakout up or down, traders will switch to swing trading. Until then, they will be quick to take profits and many will use a lot of limit order entries.
Pre-Open Market Analysis
The Emini yesterday broke below the 3 week trading range, but found support at the daily moving average. The bulls therefore see the bear breakout as a pullback in a bull trend. Yet, the bears know that the late reversal increases the odds that the bulls are right. They need to create strong follow-through selling this week if this is going to be the start of a 100 point pullback.
On June 27, the Brexit vote led to a bear breakout below a 3 month trading range. Yet, the breakout failed and the Emini reversed up strongly. The bulls want yesterday’s break below the 14 day trading range to be a smaller version of the same thing. Hence, they will try for a strong reversal up today or tomorrow and then for a new all-time high. Unless today is a big bear trend day, the bulls have a 50% chance of success.
Daily chart
While this is possible, the odds still favor a bigger pullback on the daily chart. There is a 60% chance of at least a 40 point pullback (yesterday fell about 30 points from the high) and a 50% chance of a 100 point pullback this month. A 100 point pullback would test the July 6 low, Since that was the 1st pullback after the initial strong bull reversal, it is a magnet.
The Emini might go sideways into Friday’s unemployment report. It will probably be in Breakout Mode going into the report. This means that there will be a 50% chance of a new high and a 50% chance of a bear breakout and the start of a 40 – 100 point pullback.
Globex session
The Emini is down 3 points in the Globex session. It traded in a narrow range overnight.
Forex: Best trading strategies
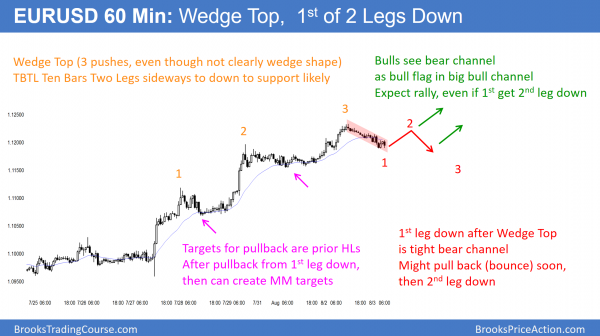
The 60 minute EURUSD Forex chart pulled back over the past 20 hours from a 3rd push up. The 3 pushes up create a Wedge Top. Hence, the rally was a buy climax. There is therefore a 60% chance of a TBTL Ten Bar, Two Legged correction sideways to down. The first leg down has been in a tight bear channel. Today will probably be sideways to up.
The 60 minute EURUSD chart has a nested bull wedge. The 3rd leg up began on Friday and it subdivided into a smaller wedge rally. A nested pattern has a higher probability of a success reversal down. Therefore, there is a higher probability of TBTL Ten Bars Two Legs sideways to down on the 60 minute chart.
A tight bear channel is an Endless Pullback. There is a 40% chance of a strong bear breakout below the bear channel, which would be a Measuring Gap. If this happens, the 60 minute chart would become a bear trend. Traders would therefore look for a measured move down.
All financial markets might go sideways into Friday’s unemployment report. At that point, they might then decide on the direction of the next breakout.
Bull case
The bulls see the selloff as a bull flag. Hence, they expect the selloff to lead to a new high in the bull channel. They have a 40% chance of being right. The bears do not mind a rally today or tomorrow because there is a 60% chance of a 2nd leg down from the rally.
Yesterday’s breakout above the month long trading range on the daily chart was strong. Yet, the EURUSD 60 minute Forex chart has traded down for 20 hours. The bulls still want follow-through buying today and a new high in the broad bull channel. If they get it, it would increase the chances of a test of the 1.1426 top of the June 24 sell climax bar. They have a 40% chance of getting the rally before the correction has a 2nd leg down.
Daily chart
The bears want this rally to convert into a trading range on the daily chart. They then will try to form a sell setup within that range. The rally over the past week was strong. Therefore, the odds are that the best the bears will get over the next few days is a trading range. They will probably need at least a micro double top before they can start a swing down.
Summary
In conclusion, the consecutive buy climaxes on the 60 minute chart will probably lead to a pullback lasting 1 – 3 days. Yet, the strength of the rally on the daily chart will probably limit the selling. The bulls will therefore buy the selloff, believing it is a bull flag. They should then be able to get at least one more push up.
Summary of today’s S&P Emini futures price action and what to expect tomorrow
The Emini had a weak rally to just above the 60 minute moving average. It spent most of the day within a 4 point range between the 60 minute moving average and the bottom of the 3 week trading range. It broke above the 60 minute moving average at the end of the day.
The Emini was in a small trading range day today. This was weak follow-through after yesterday’s bear breakout. Yet, it was not enough for the bulls either. Hence, it is neutral and probably will continue this way until Friday’s unemployment report.
Because today was a bull inside bar after yesterday’s bear breakout, it is a buy signal bar for the bulls. They see it as a sign of a failed breakout and a 20 Gap Bar buy setup on the daily chart. While it is also a sell signal bar, its bull body will make many bears unwilling to sell below today’s low.
See the weekly update for a discussion of the price action on the weekly candlestick chart and for what to expect going into next week.
Traders can see the end of the day bar-by-bar price action report by signing up for free at BrooksPriceAction.com. I talk about the detailed S&P Emini futures price action real-time throughout the day in the BrooksPriceAction.com trading room. We offer a 2 day free trial.
When I mention time, it is USA Pacific Standard Time (the Emini day session opens at 6:30 am PST, and closes at 1:15 pm PST). You can read background information on the intraday market reports on the Intraday Market Update page.


Hi Al,
When there is big trend bar in protracted trend, e.g. Big hourly bear bar that closed on its low around 1.1143, then is it a reasonable trade to use small bar as a signal bar for counter trend trade?
Many Thanks
Saad
Al – There’s no sound on your webinar for about an hour. In case you didn’t know… Thanks!