S&P500 2,200 resistance
Updated 7:00 a.m.
The Emini gapped up and made a new all-time high on the open, and began with a Buy The Close rally. Yet, the 1st 3 bars had prominent tails, and limit order bears made money. While bullish, this is a sign that the bulls are not especially strong yet. This weakness therefore increases the chances of an early high of the day and it reduces the chances of a strong bull trend day.
The small, overlapping bars with prominent tails are trading range price action. They therefore increase the chances of a lot of trading range price action all day. While the Emini can always break into a strong trend up or down, these bars are telling us that it probably will not.
Because the opening rally is a smaller time frame Parabolic Wedge Top, it is a possible high of the day. Yet, the prominent tails increase the chances of a trading range lasting 1 – 2 hours before a swing up or down begins. Most traders should wait for a breakout up or down. The odds are that today will have both a swing up and a swing down. The market is deciding which will come 1st.
Pre-Open Market Analysis
The Emini has rallied strongly for over a month. Yet, there are nested Final Flag Tops on the monthly, weekly, daily, and 60 minute charts. Nested tops have a higher probability of success. While the Emini will probably soon turn down for several weeks, there are still Measured Move targets above. Also, 2,200 is a big round number and therefore a magnet. Many bears are waiting for slightly higher prices before shorting.
Since the reversal down can begin with simply a strong bear breakout without a clear topping pattern, strong bears will also sell any strong reversal down. A big bear trend bar on the daily chart would be a “Give Up” bar and a sign that the bulls have finally given up. A bar like that often starts a swing down that can last 20 or more bars. Twenty bars on the daily chart is about a month.
Also, the monthly chart will probably pull back for about a month after 6 consecutive bull trend bars. The duration of the pullback is therefore consistent with price action on the daily chart.
Emini Globex session
The Emini was in a weak bull channel overnight. There are still targets above and therefore the rally will probably continue at least for a little higher. A reversal down can begin at any time, with or without any news.
Forex: Best trading strategies
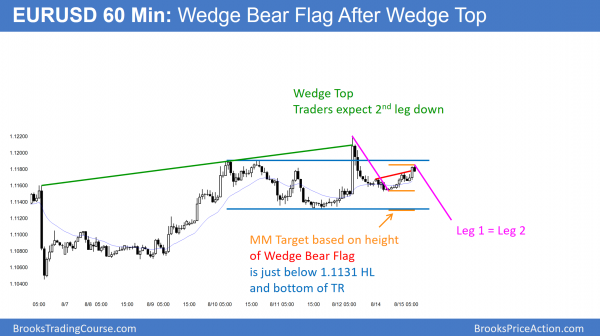
Last week formed a big wedge top (green line) so the odds favor a 2nd leg down. The entire Wedge rally is probably a pullback from the 1st leg down from a larger Wedge Top. This overnight selloff might be the start of the 2nd leg down from that larger Wedge Top.
The overnight rally formed a wedge bear flag and the bears are trying to create a good signal bar. There is a 60% chance of a selloff that will have a couple of legs down to support. Support is at the bottom of the trading range. There is also a Measured Move target just below, and a Leg 1 = Leg 2 target about 20 pips lower.
The EURUSD 240 minute chart has been in a trading range since the August 2 wedge top. A trading range usually follows a Spike and Channel Top. The Wedge top was the channel in a Spike and Channel top. I mentioned on Friday that the bulls were trying for a Leg 1 = Leg 2 rally. They therefore want a breakout above the Wedge Top. With the reversal down on Friday, the odds are that the 5 day rally was simply a pullback from the 1st leg down to the August 5 low. The rally was also a Wedge Top. Hence, the reversal down will probably subdivide into 2 legs. This 2 legged selloff would then be the 2nd leg down from the August 2 Wedge Top. It would therefore meet the objective of that top.
Developing trading range
Once there are two clear legs sideways to down, the EURUSD would clearly be in a trading range. The Trading range then becomes the pattern that will control the price action. The effect from the August 2 Wedge Top would have ended. Once a market evolves into a trading range, it is in Breakout Mode. This means that the probability of a rally is the same as for a selloff. Furthermore, the 1st breakout fails 50% of the time. Finally, once in a trading range, 80% of all breakout attempts fail and lead to reversals.
This developing trading range is within the 16 month trading range that began in early 2015. The monthly chart is already in Breakout Mode.
What happens to Forex markets if the stock market corrects?
If the Emini corrects 50 – 100 points over the next few weeks, the selloff will affect all financial markets, including Forex markets. Yet, it is impossible to know of the selloff will cause the EURUSD to sell off or rally. There is a 50% chance of either. Traders have to wait to see the breakout. They will then decide if it looks strong enough to be successful, or weak and likely to reverse.
Overnight EURUSD Forex trading
The EURUSD has been forming many Wedge patterns over the past past month on several time frames. The bears see the overnight rally as a 50% pullback from Friday’s selloff. The rally is a Wedge Bear Flag on the 60 minute chart. If this hour forms a good sell signal bar, there would be a 60% chance of a 2nd leg down today or tomorrow. That 2nd leg down might also be the 2nd leg sideways to down from the August 2 wedge top.
The bulls believe that the August 2nd already had a 2nd leg down on August 5. They therefore think that the August 2nd wedge is no longer controlling the Forex price action. Hence, for them, the August 5 higher low is part of a broad bull channel were August 2 was the end of the 1st leg up. They therefore expect a Leg 1 = Leg 2 rally up from that low.
Because the 60 minute chart is in a trading range, the probabilities are less for the bulls and bears. Yet, the bears have a slight edge. The odds favor at least a day or two of sideways to down trading.
Summary of today’s S&P Emini futures price action and what to expect tomorrow
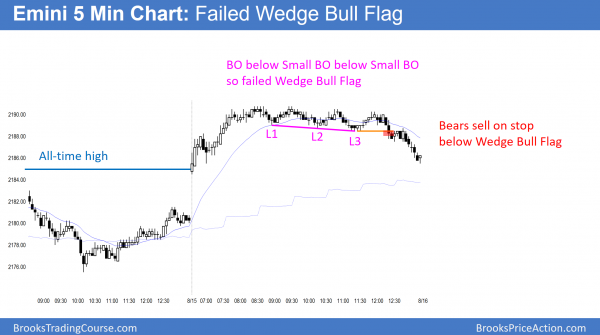
The bears sold the breakout below the Wedge Bull Flag. This is a Small Breakout Below a Small Breakout sell setup.
After a brief early rally to a new all-time high, the Emini traded in a tight trading range. The bulls want trend resumption up tomorrow and the bears want trend reversal down.
The monthly, weekly, and daily charts have a nested Final Bull Flag pattern. On each, the Emini broke to the downside and the rallied to a new high. The Emini today broke below a tight trading range on the 5 minute chart. If it rallies to a new high and then reverses down, that could be the start of the August pullback. Until then, the odds still favor a test of the 2200 – 2220 resistance.
See the weekly update for a discussion of the price action on the weekly candlestick chart and for what to expect going into next week.
Traders can see the end of the day bar-by-bar price action report by signing up for free at BrooksPriceAction.com. I talk about the detailed S&P Emini futures price action real-time throughout the day in the BrooksPriceAction.com trading room. We offer a 2 day free trial.
When I mention time, it is USA Pacific Standard Time (the Emini day session opens at 6:30 am PST, and closes at 1:15 pm PST). You can read background information on the intraday market reports on the Intraday Market Update page.


Hi Al,
You mentioned if the wedge failure were to happen, it might swing quickly down to 6L, which it did. Wondering why 6L and not 1L?
Thanks.
The rally on the open was a Spike and Channel Bull Trend. The Channel began with the the 1st PB from the initial 4 bar rally (Spike). That PB was the bar 6, and that is the most common target. However, it could have easily continued down to the L of the day and the 60 min MA.