Stock market probably ignoring Senate filibuster nuclear option
Updated 6:53 a.m.
The Emini gapped up and rallied strongly above last week’s high, triggering a buy signal on the weekly chart. It is Always In Long and there is a 60% chance that we have seen the low of the day. Yet, when there is a gap up and rally, the Emini usually enters a tight trading range within the 1st hour. If so, the odds favor trend resumption up later in the day.
Traders always have to watch for a possible parabolic wedge top or a failed breakout. The bears would need at least a micro double top or a series of bear bars before traders will think that the bears have gained control.
Pre-Open market analysis
The Emini was in a trading range again yesterday. Consequently, it was the 5th day in the sideways pullback from last week’s strong 2 day rally. The Emini is therefore in Breakout Mode. Because the last strong move was last week’s 4 day rally on the daily chart, the odds favor trend resumption up.
Yet, the Emini has been in a trading range for 2 months and is now in the middle. Hence, the probability is not as good as traders want. Because there is no evidence of an impending breakout up or down, the odds favor more days within the range. Consequently, the rally will probably fail around the March 15 lower high.
The bears will try to create a double top lower high major trend reversal there. The bulls need a strong breakout above that lower high to convince traders that the 2 month correction is over. Without that, the bears still have a 50% chance that the 5% correction down to the December close is still progressing.
Overnight Emini Globex trading
The Emini is up 5 points in the Globex session. It will therefore probably gap up on the open. While there is at least a 50% chance that the Emini is in an early bear trend on the daily chart, the odds are that it will rally up to test the March 15 lower high. The two day bounce is a possible start of the next leg up. There might be one more test of Monday’s low before the rally to the March 15 high begins. In either case, traders should expect at least a couple bull trend days soon.
Since last week was a buy signal bar on the weekly chart, the Emini will probably trade above its 2366.75 high today or tomorrow. This is because traders need to see if there are more buyers than sellers there. The odds are that the breakout above last week’s high will lead to a test of the March 15 2387.75 lower high. This is true even if there is a pullback from above last week’s high first.
EURUSD Forex market trading strategies
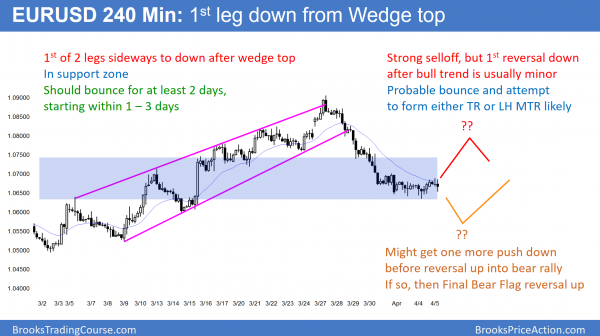
The EURUSD 240 minute Forex chart has been in a tight trading range after a strong selloff. The odds favor a 100 – 150 bear rally soon. Yet, there might be one more small push down before the reversal up.
The EURUSD Forex market has been sideways for 4 days after a strong reversal down from a wedge top. Since it is still within a 5 month trading range, the odds favor a bounce soon. Yet, last week’s selloff was strong. Consequently, this trading range is a breakout mode setup. Hence, if the bears get their downside breakout, they will see this range as a bear flag. The selloff would probably fall for about 50 pips to a measured move down. It would then likely reverse up for a week or more from a Final Bear Flag Bottom.
On the other hand, the EURUSD might rally from this trading range without first having one final bear leg. The bulls would then see this trading range as a major trend reversal buy setup.
In either case, the odds favor a 100 – 150 pip rally up to resistance before a break below the bottom of the 5 month range.
Overnight EURUSD Forex trading
Because the EURUSD chart has been in a 50 pip range, day traders will continue to scalp until there is a breakout. A trading range always has both a reasonable buy setup and a reasonable sell setup. Therefore, traders have to be ready for a breakout in either direction.
Summary of today’s S&P Emini futures price action and what to expect tomorrow
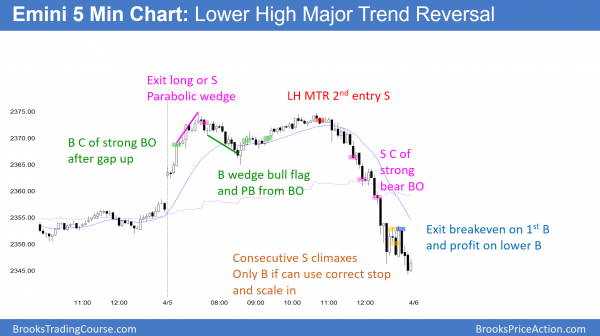
The Emini gapped up, but reversed down strongly from a lower high major trend reversal. It sold off to below yesterday’s low and formed a big outside down day.
The Emini triggered a buy signal on the weekly chart, but reversed down strongly from a wedge lower high on the daily chart. The odds are that the Emini is in a 5% correction down to the December close, but it might test the March 15 lower high first.
See the weekly update for a discussion of the price action on the weekly candlestick chart and for what to expect going into next week.
Traders can see the end of the day bar-by-bar price action report by signing up for free at BrooksPriceAction.com. I talk about the detailed S&P Emini futures price action real-time throughout the day in the BrooksPriceAction.com trading room. We offer a 2 day free trial.
When I mention time, it is USA Pacific Standard Time (the Emini day session opens at 6:30 am PST, and closes at 1:15 pm PST). You can read background information on the intraday market reports on the Intraday Market Update page.

