Trump’s health care bill and tax reform might disappoint bulls
Updated 6:55 a.m.
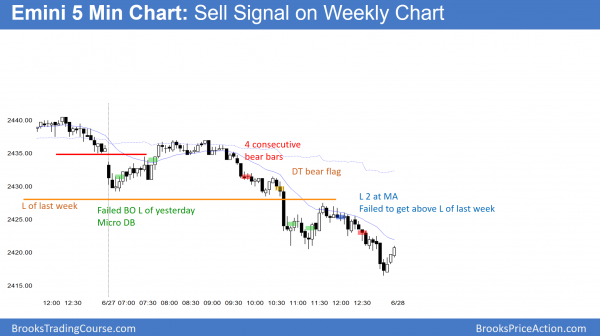
Last week is a sell signal bar on the weekly chart. Today’s early selloff is a test of last week’s low. The bears need a strong breakout and follow-through over the next several days if they are going to get a reversal down. Most reversal attempts fail, even if there is a strong breakout. Yet, the context is good for the bears.
Even though the 1st 2 bars were bear bars, limit order bulls made money. This reduces the chances of a strong bear trend day. The bulls don’t mind a selloff below yesterday’s low as long as they get a reversal up. That would be a 2nd reversal up from below yesterday’s low. Hence, it would be a higher probability buy.
The bears so far have a weak bear breakout. The bulls and bears are both making money at the support of the lows of the past 3 days. In addition, most days have been trading range days for the past month. Furthermore, neither side has been strong on the open. Therefore, the odds are that this will be a trading range open for the 1st hour or two. It also reduces the chances of a strong trend day up or down. Today will probably have mostly trading range trading again.
Pre-Open market analysis
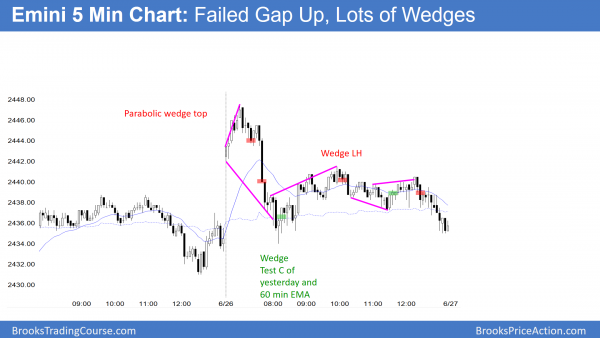
The Emini gapped up and sold off yesterday, but was mostly a trading range day. Nothing has changed from the weekend. The Emini is exceptionally overbought on the weekly chart. Hence, it is likely to sell off 100 points over the next few months to test the March 27 low. This is the bottom of the wedge rally. The wedge rally is likely a bull leg in what will become a trading range for the next several months.
Yet, there is no clear top yet. Furthermore, buy climaxes can extend much further than what appears likely. Therefore, the rally could continue up indefinitely. More likely, it will begin to reverse from here or from a minor new all-time high.
Because most days over the past month have been mostly trading range days, the odds are that today will be another. However, traders need to be ready for a big bear trend day forming at any time.
The next week is typically up. But, because of the weekly buy climax, the reversal down to the weekly moving average can begin at any time.
Overnight Emini Globex trading
The Emini is down 2 points in the Globex market. It therefore might gap below yesterday’s low. Yesterday is a sell signal bar on the daily chart. Furthermore, it is a double top lower high with last week’s all-time high.
As climactic as the weekly chart is, all of the reversal attempts on the daily chart over the past several months have failed. The odds are that this one will as well. Therefore, traders expect another trading range day. Hence, they expect a trend one way for a couple of hours. Then, they expect either a trading range or a reversal. Most days for the past month behaved this way, and therefore today will probably be another.
However, a 100 point reversal down is likely to begin soon. Therefore, day traders will be ready for a big bear trend day at any time. This is unlike most of the days of the past month where selloffs reversed back up in the middle of the day.
While there are many types of bear trends, the strongest is a small pullback bear trend. If there is a selloff that looks weak and like a bear leg in a trading range day, but it forms a couple of gaps down in the 1st 2 hours, day traders should consider swing trading part of their position. By a gap, I mean that a pullback from a breakout does not overlap the breakout point. This is how small pullback bear trend days begin. If today becomes one, it can sell off relentlessly and very far.
Yesterday’s setups
Here are several reasonable stop entry setups from yesterday.
EURUSD Forex market trading strategies
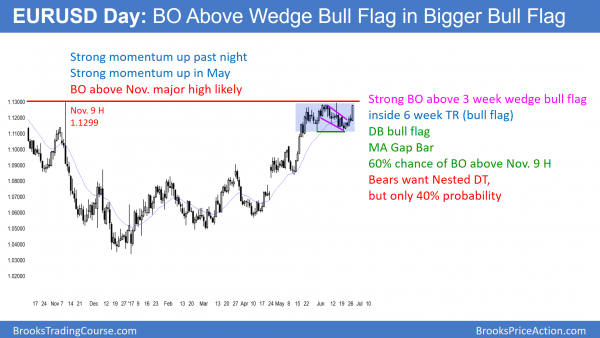
The EURUSD daily Forex chart has a big bull bar today. It is breaking strongly above the 3 week wedge bull flag. That flag is within a 6 week trading range in a strong rally in May. There was a bar last week that was below the moving average (a gap between its high and the average). This is the 1st gap bar in the trend, and is usually followed by at least a test of the high.
The EURUSD Forex market has been sideways for 6 weeks after a strong rally in May. It stalled 4 pips below the November 9 major lower high. The odds are that it will break above that high after getting so close and after such strong momentum up. Yet, it is still in a 2 year range. In addition, this 6 month rally so far is just a bull leg in that range. Since trading ranges resist breakouts, the odds are that this rally will be followed by a bear leg, and not a successful breakout above the 2 year range.
Overnight EURUSD Forex trading
The EURUSD Forex market rallied 100 pips in a tight bull channel overnight. This is a strong enough rally so that the odds are that the bulls will buy the 1st reversal down. Furthermore, it is strong enough to probably be a resumption of the May bull trend and not just a bull leg in the 6 week trading range.
Even if it enters a 50 pip trading range before breaking above the November 9 high, there is still a 60% chance of a breakout above that high. The minimum target is a measured move up based on the 200 pip height of the 6 week trading range. Day traders will focus on buying selloffs, betting that they will be bull flags. Swing traders will hold long, even at the top of the 6 week trading range. This is because the odds favor a break above the November high.
Summary of today’s S&P Emini futures price action and what to expect tomorrow
The Emini triggered a weekly sell signal by falling below last week’s low. Today was a weak bear trend.
By trading below yesterday’s low, the Emini triggered a double top sell signal on the daily chart. Since it also traded below last week’s low, it also triggered a weekly sell signal. Friday is the end of the month. The bears would like Friday to close below the open of the month to create a sell signal bar on the monthly chart. The bears need a strong reversal down to make traders conclude that the selloff to below the weekly moving average has begun.
See the weekly update for a discussion of the price action on the weekly candlestick chart and for what to expect going into next week.
Traders can see the end of the day bar-by-bar price action report by signing up for free at BrooksPriceAction.com. I talk about the detailed S&P Emini futures price action real-time throughout the day in the BrooksPriceAction.com trading room. We offer a 2 day free trial.
When I mention time, it is USA Pacific Standard Time (the Emini day session opens at 6:30 am PST, and closes at 1:15 pm PST). You can read background information on the intraday market reports on the Intraday Market Update page.


