Unemployment report stock market breakout
Updated 6:56 a.m.
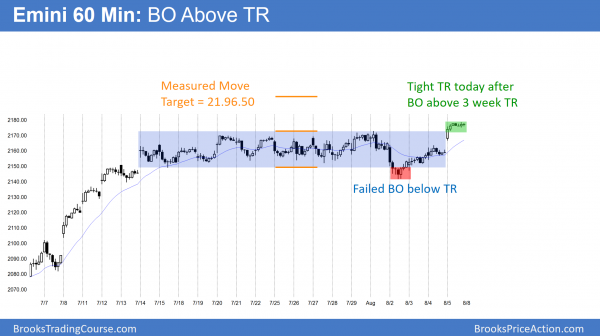
The Emini gapped up and formed a Buy The Close rally to a new all-time high. The bears want a failed breakout above the 3 week trading range. However, the bulls want a Pain Trade rally and a strong bull trend day, like a Spike and Channel Bull Trend. The Emini is trying to break above its 4 day channel. There is only a 25% chance of success, but this breakout so far is strong.
This is therefore a low probability event. When a low probability event happens, many traders are in denial and they keep betting against it. Hence, there is the potential of a very big bull trend as losing bears keep buying back losing shorts. This happens a couple of time a month. At the moment, the Emini is Always In Long with no sign of a top.
More likely, the Emini will rally for an hour or so and then enter a tight trading range for several hours. Later in the day, it will chose between Trend Resumption up and Trend Reversal down.
The third possibility is an Opening Reversal down from Monday’s all-time high. This would therefore be a double top sell setup. An Opening Reversal down from a strong rally is usually a Parabolic Wedge Top. If there is a parabolic wedge top or a strong reversal down, this rally might form an early high of the day.
Pre-Open Market Analysis
Wednesday failed to continue the breakout below a 3 week trading range, and therefore a buy signal bar. The Emini yesterday triggered a buy signal by going above Wednesday’s high. Yet, yesterday only formed a doji bar instead of a strong bull trend bar. The lack of follow-through selling after Tuesday’s bear breakout below the 3 week trading range disappointed the bears. Similarly, the weak buy entry bar yesterday disappointed the bulls. Disappointed bulls and bears is a hallmark of a trading range. Hence, the past 3 days are basically an extension of the 3 week trading range.
Breakout Mode
The Emini is still in Breakout Mode. While it is still in a bull trend on the daily chart, Tuesday has a 50% chance of being the start of a 40 – 100 point pullback. There is a 50% chance of one more new high before the pullback begins. While there is a 40% chance that the bull trend will resume without a pullback in August, the odds are that there will be sellers at the all-time high. The stop is now about 100 points below. That creates too much risk for many institutions. They therefore will look to reduce their position size on rallies. Bears will also begin to sell, betting that the bull trend will soon evolve into a trading range.
Globex Emini session
The Emini rallied on the Unemployment Report this morning. While it broke above Tuesday’s sell climax high, it quickly pulled back to the middle of the breakout. Therefore, although a bull breakout is a sign of strong bulls, the rally continues to look like part of a trading range. The Emini has rallied for 3 days without much of a pullback. This is a Big Down, Big Up candlestick pattern. Hence, it is a sign of confusion, which is a hallmark of a trading range.
The bears still see the rally as a pullback from the breakout below the 3 week trading range. While the pullback is much stronger than the bear want, as long as it stays below last week’s all-time high, they still have a 50% chance of getting a lower high major trend reversal on the 60 minute chart. This means they still have a 40% chance of a swing down. That swing down could be 100 points and test the July 6 higher low.
The bulls see a failed bear breakout below the 3 week trading range, and are hoping for a new all-time high. They would then therefore run the stops on the bears. Hence, they hope that a new high would form a measuring gap and begin a new strong leg up.
Importance of Friday and the weekly chart
Today is Friday. Therefore, weekly support and resistance can be important magnets, especially at the end of the day. The bodies on the weekly chart have been shrinking for 6 weeks. This week might finally have a bear body. The bulls want a close above the open of the week and above last week’s all-time high. The bears want a close below the open of the week and below last week’s low.
Forex: Best trading strategies
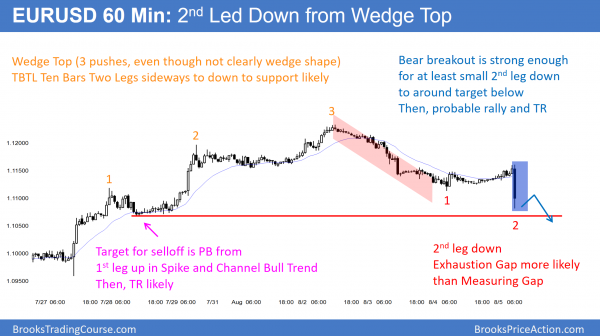
The 60 minute EURUSD Forex chart broke strongly to the downside after the Unemployment Report. This is a 2nd leg down after a Wedge Top. Support at the bottom of the 1st pullback in the wedge rally is pulling the market down. Yet, the biggest bear trend bar late in a bear trend is more likely an exhaustive sell climax than the start of a strong leg down.
The bar is big enough so that the 1st bounce will find sellers. However, traders will probably quickly buy the 2nd leg down from this breakout. This is still a big 2 legged correction from a Wedge Top. The 2nd leg down will probably divide into 2 small legs (today is the 1st). There is only a 40% chance of a Measured Move down. In conclusion, the pullback will probably end within a couple of days. There will then probably be a rally to a lower high and the chart will evolve into a trading range.
The EURUSD 60 minute Forex chart is pulling back from a wedge top 2 days ago. The selloff has been in a tight channel. It is therefore likely just the 1st leg down. Hence, traders will be looking to sell a rally, knowing that the odds are that it will fail to get much above the wedge high.
A wedge buy climax usually is followed by 2 legs sideways to down. It then typically evolves into a trading range. Therefore it probably will be sideways for at least a week, despite a likely bounce tonight or tomorrow.
While a trading range is likely, there is still a 25% chance that either this selloff is the start of a bear trend, or the end of a pullback in a bull trend. Day traders need to see a strong breakout up or down before they are confident that the EURUSD has begun to trend.
Friday’s Unemployment Report
All financial markets are trying to get neutral going into the report. This is because it is a catalyst and it can lead to a surprisingly big move up or down. The math is better for both the bulls and bears when a market is neutral before a report. Will the Forex markets begin to trend after the report? Probably not for more than a day or so. The charts look like they want to go sideways on the 60 minute chart, whether there is a one day trend.
Summary of today’s S&P Emini futures price action and what to expect tomorrow
The Emini gapped up and rallied to a new all-time high. The 60 minute chart then entered a tight trading range. The height of the 3 week trading range created a Measured Move target at 2196.59. Yet, the 2200 round number is also a magnet just above. The odds are that the Emini will test the targets next week.
The bulls began with a Buy The Close bull trend. When that happens and the Emini is already at the top of a bull trend, it usually enters a tight trading range for several hours. This happened today. When there is bull trend resumption, it usually is limited, as it was today.
The breakout was strong enough on the daily chart to make bulls buy the 1st pullback next week. However, the 3 week tight trading range might become the Final Bull Flag.
See the weekly update for a discussion of the price action on the weekly candlestick chart and for what to expect going into next week.
Traders can see the end of the day bar-by-bar price action report by signing up for free at BrooksPriceAction.com. I talk about the detailed S&P Emini futures price action real-time throughout the day in the BrooksPriceAction.com trading room. We offer a 2 day free trial.
When I mention time, it is USA Pacific Standard Time (the Emini day session opens at 6:30 am PST, and closes at 1:15 pm PST). You can read background information on the intraday market reports on the Intraday Market Update page.

