Weak Emini weekly sell signal for double top above 2800
I will update again at the end of the day.
Pre-Open market analysis
After breaking almost 20 points above the 2800 Big Round Number last week, the Emini pulled back to test 2800 on Friday. The bulls want a resumption of the July rally and a breakout to a new all-time high.
However, the daily chart has been in a trading range for 6 months. Trading ranges resist converting into a trend. Consequently, it is more likely that the trading range will continue than become a bull trend. Therefore, the bulls will take profits above 2800 and the bears will sell. The odds are that the Emini will go sideways to down for the next several weeks, even it it breaks slightly above last week’s high first.
Last week was a bear bar on the weekly chart. It is therefore a sell signal bar for this week for a failed breakout above the March high. But, it was only a doji and it followed a big bull bar. This is a weak sell setup. Therefore, there will likely be more buyers than sellers below last week’s low.
Overnight Emini Globex trading
The Emini is up 1 point in the Globex market after dipping below the 2800 Big Round Number. After last Tuesday’s strong rally, the Emini has been consolidating. The past 2 days are forming a wedge bull flag. Therefore, the bulls will probably get a test back up to last week’s high within a few days.
The bears want a strong break below last Tuesday’s low of 2790.75. This would increase the chance of a swing down for a few weeks. The bears do not mind a rally back up to last week’s high. They would then try to create a double top and begin a swing down on the daily chart.
After 3 small days, today will probably again be mostly sideways. If there is a rally to last week’s high, it will probably fail within a few days. Alternatively, if there is a break below last week’s low, it, too, will likely not fall far. The odds are for more sideways trading for at least another week.
Friday’s setups
No chart for last Friday. I was speaking about Advanced Emini Scalping at the Chicago Mercantile Exchange in Chicago and I was not trading.
EURUSD Forex triangle so breakout mode
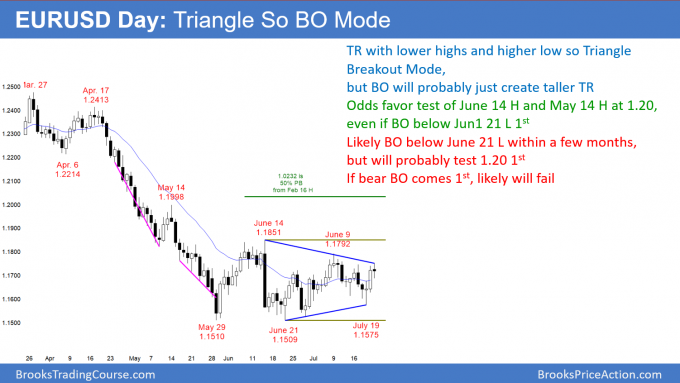
The EURUSD daily Forex chart has lower highs and a higher low in its 2 month trading range. This is therefore a Triangle, but there is no sign of a breakout.
The EURUSD daily Forex chart has been in a Triangle for a couple of months. It is therefore in Breakout Mode. In general, a Triangle has a 50% chance of a successful bull breakout and a 50% chance of a successful bear breakout. Furthermore, there is a 50% chance that the 1st breakout will fail.
I adjust these numbers based on context. This Triangle followed a series of sell climaxes and is at major weekly support. In addition, the May 14 lower high missed the 1.20 Big Round Number by only 2 pips. That is therefore a magnet above.
The odds are that there will be a rally to the June 14 sell climax high and then to 1.20. This is true even if there is a break below the June 21 low and 1.15 1st. If the bears get their breakout, the Triangle will probably be the Final Bear Flag in the May bear trend. The breakout would likely fail within 200 pips and then the bulls would get their rally to 1.20.
If the rally to 1.20 comes before the bear breakout, it will probably form a lower high. The bears would then get a 2nd leg down to below 1.15. That would probably fail somewhere above 1.12 and form a large wedge bull flag on the weekly chart.
As you can see, the odds favor continued trading range trading for many months. The market should rally to 1.20 and fall to around 1.13. Traders are now deciding which will happen 1st.
Overnight EURUSD Forex trading
Since the EURUSD daily Forex chart is at the apex of a triangle, traders expect reversals every 2 – 3 days. The past 3 days were up, but there is room to the June 9 lower high just below 1.18. Therefore, the odds are that today will stall and enter a trading range on the 5 minute chart. The 3 day rally was in a tight bull channel. This makes a strong bear day unlikely.
Summary of today’s S&P Emini futures price action and what to expect tomorrow
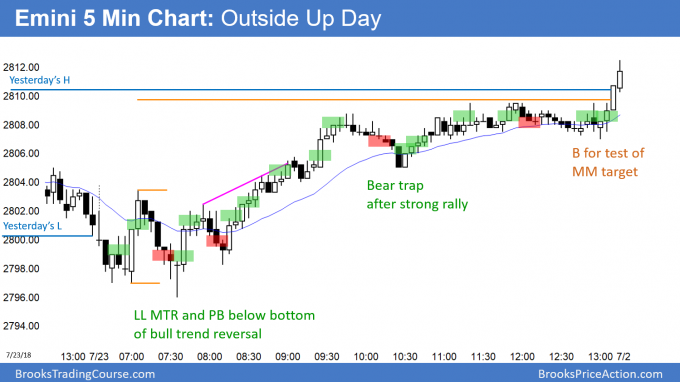
Here are several reasonable stop entry setups for today. I sometimes also show limit order entries and entries on the close of bars. My goal with these charts is to present an Always In perspective. If a trader was trying to be Always In or nearly Always In a position all day, and he was not in a position at the moment, these entries would be logical times for him to enter.
The Emini reversed up from below Friday’s low and from above last Tuesday’s low. A brief rally a the end of the day went above Friday’s high. Therefore, today was an outside up day, and a sign of strong bulls.
However, last week is a sell signal bar on the weekly chart. In addition, last week formed a double top with the March high. This conflicts with the daily chart and it increases the chance of more sideways trading likely.
See the weekly update for a discussion of the price action on the weekly candlestick chart and for what to expect going into next week.
Traders can see the end of the day bar-by-bar price action report by signing up for free at BrooksPriceAction.com. I talk about the detailed S&P Emini futures price action real-time throughout the day in the BrooksPriceAction.com trading room. We offer a 2 day free trial.
When I mention time, it is USA Pacific Standard Time (the Emini day session opens at 6:30 am PST, and closes at 1:15 pm PST). You can read background information on the intraday market reports on the Intraday Market Update page.


Al- Thanks for answering my question today about July 19, but the question was about bar 17, not bar 1 which you discussed. It was a good looking bull bar closing on its high, but with resistance above. I passed due to the 5-minute moving average and potential double top above. The question is basically: which is more important, the nature of the bar and the position in the range, or the possibility of resistance above? Thanks for all your help.
Anything can be most important. In that particular case, the math was probably not good for a scalp, unless a trader was willing to use a wide stop and scale in. However, the Emini was Always In Long, and therefore it was reasonable to B for a HL MTR and a 2nd failed BO below yesterday’s low. My general rule is that I am not comfortable, I wait. If I was trading, I would have bought it for a scalp and I might have used a wide stop. Alternatively, I would trade small and use a tight stop. If stopped out, look for a 2nd B and trade a full size position.
Al,
Perhaps another indicator of a lack of consensus or commitment during a protracted trading range ? —
You mention “Last week was a bear bar on the weekly chart”
That matches the IB chart for Sept 18 ES.
Though, on SPY, the close was 0.04 above the open, and 0.09 above the close of the previous week (at least per chart data at IB).
stockcharts.com shows $SPX a few tics up on same 2 measures.
Given that SPY & $SPX track ES so closely, and that SPY is so heavily traded, this seems one more (potential) confirmation of trading range inertia, and one wonders if there is greater variation among different expirations than usual.
Mentioning this as I imagine others may have also noticed the same, and wondered.
30 years ago, many traders traded S&P futures based on the SPY, which was the dominant trading vehicle for S&P traders. Over the past 10 years, I believe that the Emini has become the most important S&P vehicle for institutions. Its price is more important than anything else. I ignore the SPY, except for trading SPY options. As a day trader, I also ignore the cash index. But, your point is valid. The minor differences point to confusion, which makes sideways likely.