Yesterday’s strong Emini rally might form micro double top
I will update again at the end of the day.
Pre-Open market analysis
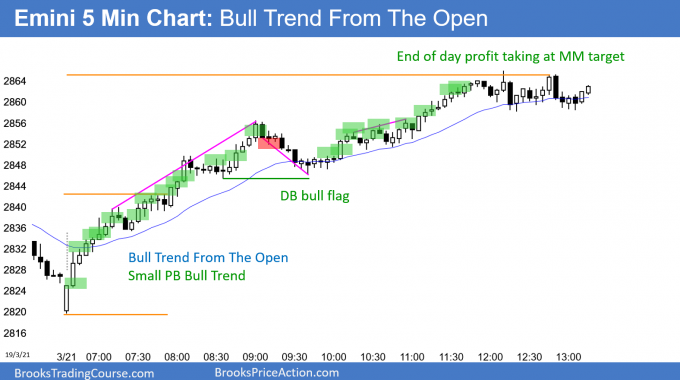
Yesterday was a strong bull trend day. By going above Wednesday’s high, it triggered a buy signal on the daily chart. But, Wednesday had a bear body and therefore was a weak buy signal bar. That increases the chances of a failed breakout and a small trading range over the next few days.
The bulls want this breakout above the October high to continue up to a new all-time high. While a new high is likely this year, this buy climax is extreme. It is also testing major resistance at the 2825 triple top. Consequently, despite the strong bull trend, there is still a 50% chance of a reversal down from below the all-time high.
While yesterday was a good entry bar for the High 1 bull flag, Wednesday was a bad buy signal bar. Therefore, there will probably be sellers above Wednesday’s high.
The odds are against today being another strong bull day. However, if it is, the odds will shift in favor of a new all-time high within the next several weeks.
Since yesterday was a buy climax day, there is a 50% chance of follow-through buying in the 1st 2 hours. But, there is only a 25% chance of a strong bull trend day. Finally, there is a 75% chance of at least a couple hours of sideways to down trading that starts by the end of the 2nd hour.
Nested buy climaxes
Yesterday was a buy climax within a 10 day buy climax. This is nested within a 3 month buy climax. I see this as a variation of a parabolic wedge top. Therefore, there is a 40% chance that yesterday will end up as the final leg up in a 3 month rally, and the start of a 1 – 2 month selloff.
The odds will go up if today closes near its open and is a doji day. They will go up more is today closes near its low, And, they will go up more if there are 3 consecutive bear days next week.
Overnight Emini Globex trading
The Emini is down 18 points in the Globex session. Today is unusually important. If the bulls get a big bull day closing near its high, the odds will favor a move up to the all-time high. If not, the Emini will probably go sideways for a few days. Then, traders will look for a reversal from an extreme buy climax. Since it is a nested buy climax, it is a parabolic wedge rally.
Can today totally reverse yesterday? That sometimes happens, but it is rare. More likely, today will be neutral. The bulls will be exhausted and the bears will be hesitant to sell after a huge bull day. But, what happens over the next few days determines what the next 2 months look like.
With yesterday’s range being so big, today will probably have at least one swing up or down. A trading range day is likely. Then, next week gets interesting.
Yesterday’s setups

Here are several reasonable stop entry setups from yesterday. I show each buy entry with a green rectangle and each sell entry with a red rectangle. I rarely also show limit order entries and entries on the close of bars. My goal with these charts is to present an Always In perspective. If a trader was trying to be Always In or nearly Always In a position all day, and he was not currently in the market, these entries would be logical times for him to enter.
EURUSD Forex market trading strategies

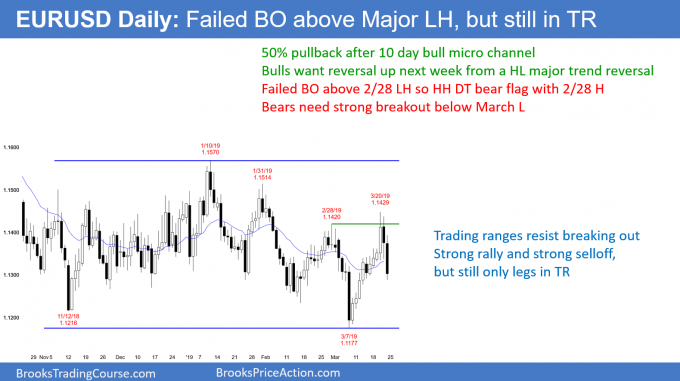
After rallying for 10 days without a pullback, today is the 2nd consecutive huge bear trend day on the EURUSD daily Forex chart. Big Up, Big Down creates Big Confusion and typically results in a trading range. Consequently, the daily chart will probably begin to go sideways for several days.
I mentioned yesterday that there would probably be a pullback and it could retrace about half of the 10 day rally. The overnight selling did that. Can this continue down to below the March low? Of course, but after a 10 day rally, a higher low and a bounce is likely. This is especially true after the 2 month wedge bottom.
Trading ranges repeatedly disappoint bulls and bears. Failed breakouts are more common than successful breakouts. The breakout above the February 8 major low high is failing. This is just like the January breakout above the November high and the March breakout below the November low.
Overnight EURUSD Forex trading
The EURUSD 5 minute Forex chart collapsed 100 pips in less than an hour at the start of the European session. It has been in a 20 pip trading range since. It is also at the support of a 50% retracement of the 10 day rally.
The selloff was a Dominant Feature. When there is something that is dominant, it typically dominates the rest of the day. Therefore, today will probably not reverse the selloff. In addition, such dominant price action usually has some follow-through for several days. Therefore, the 1st reversal up will likely fail. Traders will be more inclined to sell rallies for at least a couple days.
Can today simply be a climactic test of support at a 50% retracement? Sometimes the 1st leg up in a bull trend has a shockingly big selloff that quickly reverses back up and forms a higher low major trend reversal. That is unlikely without the selling stopping for at least a couple days.
Most likely, the 4 hour tight range will continue today, and it will be difficult to make more than 10 – 20 pips on a trade.
Since the 10 day rally was strong, the bulls will try to get the day to close above its low, despite the strong selloff. Therefore, day traders will be willing to buy, despite the crash on the 5 minute chart.
Summary of today’s S&P Emini futures price action and what to expect tomorrow

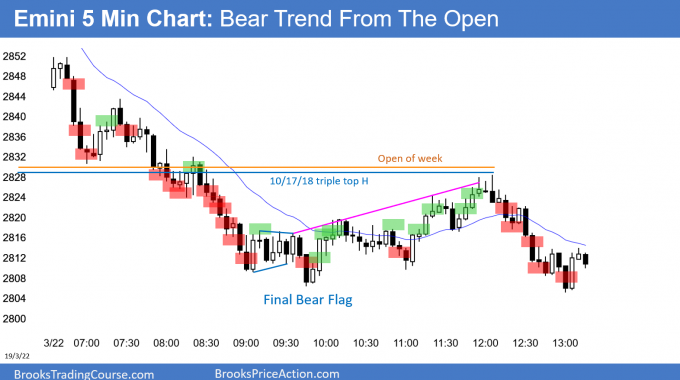
Here are several reasonable stop entry setups for today. I show each buy entry with a green rectangle and each sell entry with a red rectangle. I rarely also show limit order entries and entries on the close of bars. My goal with these charts is to present an Always In perspective. If a trader was trying to be Always In or nearly Always In a position all day, and he was not currently in the market, these entries would be logical times for him to enter.
End of day summary
The Emini sold off in a Bear Trend From The Open. It reversed up from a higher low major trend reversal. But, the rally was weak and it failed near the open of the week. The week closed below its open and at the low. This week is a sell signal bar on the weekly chart for next week.
The next several days will tell traders whether the rally will continue up to the all-time high without more of a pullback, or if the Emini might be beginning a 1 – 2 month selloff.
See the weekly update for a discussion of the price action on the weekly chart and for what to expect going into next week.
Trading Room
Traders can see the end of the day bar-by-bar price action report by signing up for free at BrooksPriceAction.com. I talk about the detailed S&P Emini futures price action real-time throughout the day in the BrooksPriceAction.com trading room. We offer a 2 day free trial.
Charts use Pacific Standard Time
When I mention time, it is USA Pacific Standard Time (the Emini day session opens at 6:30 am PST, and closes at 1:15 pm PST). You can read background information on the intraday market reports on the Intraday Market Update page.
Hi Al,
Thank you for scrolling bar-by-bar today during your EOD discussion. It reminded me of the “old days” when you would do that. It is so much more beneficial seeing only the bars up to the bar you are discussing to eliminate the natural bias that occurs when you can see what happened later.
Have a great weekend!!
Alan
Hi Al,
Many thanks for responding to my question yesterday. Today, I followed the advice you gave, and it worked like a charm. In fact, I was a little unnerved at how well it worked. I kept waiting for disaster to strike, but instead, I felt mostly in control the whole time.
My first trade was at 6:50. When I saw the large breakout bar close near its low, I held my breath and sold short one tick below. At the measured move, I closed out the trade. Then I just repeated the same strategy–up and down–until late in the session. It’s amazing how many points you can accumulate when you’re on the right side of the market! I can’t wait until Monday.
Thanks again, sincerely, and I hope you enjoy your weekend as much as I will mine.
John