Monthly S&P500 Emini futures candlestick chart:
September or October stock market correction
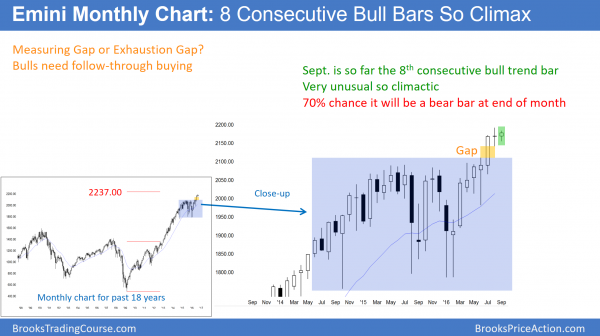
The monthly S&P500 Emini futures candlestick chart had its 7th consecutive bull trend bar last month. Although today is early in the month, there is a 70% chance that September will close below its open.
While the monthly S&P500 Emini candlestick chart in August was only a doji bar, it had a bull body. It was therefore the 7 consecutive bull trend bar on the monthly chart. While there have been many strong rallies over the past 20 years, few have had 7 consecutive bull trend bars. Hence, this is rare and therefore unsustainable. This rally therefore is a type of buy climax. Maybe it gets another bull trend bar this month. The odds are against it. There is a 70% chance that September will close below it open of 2168.25 from yesterday. The Emini can still rally to a new high this month. Yet, the odds are that it will close below its open.
Furthermore, if you look back at all of those other times when the monthly chart rallies for 6 or 7 months, most were soon followed by about a 100 point pullback. That means that the Emini will probably fall about 100 points in September or October. Significantly, September historically is the weakest month of the year, and the market has had some major selloffs in October.
Finally, the stops for the bulls is about 100 points below. Bulls have to reduce risk. The easier way is to take profits. The rally is a crowded trade. Therefore, even a little profit taking could make many traders sell. Hence, the market could quickly fall 100 points.
The case for the bulls
There always is an opposite argument. There is a 25% chance of a strong breakout above the 2 year trading range that relentlessly rallies to the 2400 measured move target. That means that there is a 75% chance of at least a 1 – 3 month, 100 point pullback before reaching that target. Even if there is a 100 point pullback, 7 consecutive bull trend bars represent eager bulls. Therefore, bulls will buy even a 100 point selloff, betting that the 1st reversal down will become a bull flag. The probability is on their side.
In conclusion, the Emini will probably soon correct about 100 points, whether or not it 1st rallies to the 2200 – 2220 measured move targets first. Furthermore, bulls will probably buy the selloff for a test back up to the high. While the 2 year trading range probably will be the Final Bull Flag on the monthly chart, the reversal down to 1500 – 1800 might not begin until after the Emini rallies to the 2400 measured move target.
Weekly S&P500 Emini futures candlestick chart:
Tight trading range
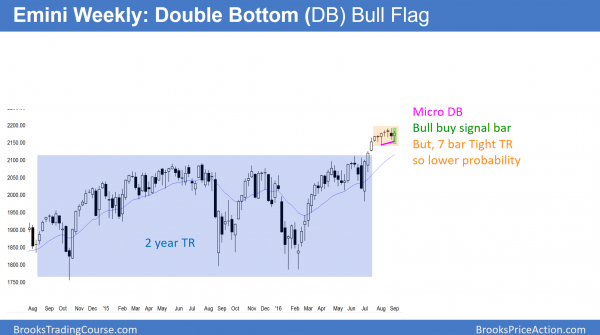
The weekly S&P500 Emini futures candlestick chart had another doji candlestick pattern this week. This is the 6th consecutive week in a tight trading range.
The weekly S&P500 Emini futures candlestick chart had its 6 consecutive doji candlestick pattern this week. It is therefore neutral and in breakout mode. While it is in a strong bull trend, the rally was climactic. The bulls hope to work off the excess by going sideways, and then get trend resumption up. Yet, the Emini broke above a 2 year trading range late in a bull trend. Because this breakout is so late in the bull trend, the gap between the current price and the top of the 2 year trading range will probably close.
If there is a bull breakout above the 6 week trading range, it probably will fail. Therefore, the odds are that the Emini will trade below 2100 and close the gap, even if it 1st goes a little higher.
Daily S&P500 Emini futures candlestick chart:
Two month tight trading range
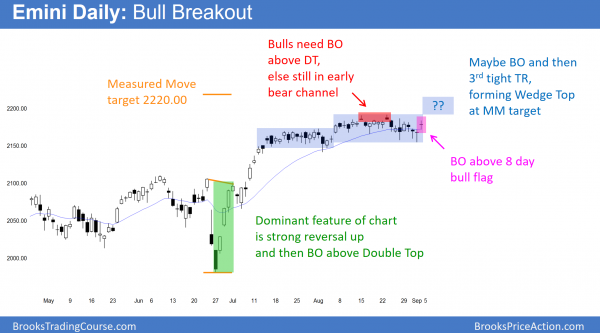
The daily S&P500 Emini futures candlestick chart had been in a tight trading range for 2 months. The bulls have momentum on their side, and the bears have a buy climax in their favor.
The daily S&P500 Emini futures candlestick chart rallied strongly in July and is holding the moving average. Yet it has been in tight trading ranges in July and in August. The stop for the bulls is still below the July 6 pullback low, which is about 100 points below. Because that means their risk is great, they need to reduce that risk. The easiest way is to take profits.
Many of the buyers over the past 2 months bought simply because the Emini was going up. These momentum bulls will be quick to get out if the Emini starts to go down. Once institutions begin to take profits to reduce risk, that slight pullback can panic the momentum bulls. As a result, the Emini could sell off very quickly to below the 2100 top of the 2 year trading range.
Lower highs so early bear trend
The bears see the August 15 and 23 double top as a reasonable start of the bear trend. They see July as the Final Bull Flag.
They also see lower highs since then on the 60 minute chart. The 60 minute chart has an interesting pattern. IT formed a Wedge Bull Flag with its reversal up yesterday. Yet, that bull flag has a problem. When a Wedge Bull Flag is mostly horizontal and has big swings, the 3rd breakout is a small breakout of the 2nd breakout, which is a small breakout below the 1st leg down. This is a Small Breakout of a Small Breakout pattern. The final component to the sell setup is a rally up from that 3rd low. The Thursday and Friday rally fulfilled that requirement.
If the Emini then falls below the Thursday bottom of the Wedge, it would have have a 50 – 60% chance of a measured move down. That would be about a 100 point correction.
The bull case
The bulls think that the July rally was so strong that it will have a 3rd push up. The momentum up was strong enough to make that more likely than not. Furthermore, there are still measured move targets around 2200 – 2220.
While the 2 month tight trading range has about a 50% chance of a breakout up or down, the probability is slightly higher for the bulls. Yet, if the bulls get their 3rd push up to the targets above, the breakout will probably fail. That would therefore be a wedge top at resistance, and it would probably lead to the 100 point pull back.
There is also a 30% chance that the Emini continues up to the 2400 measured move target without closing the gap at 2100. That probability would go up to 40 – 50% if there is a strong breakout above 2220.
Traders can see the end of the day bar-by-bar price action report by signing up for free at BrooksPriceAction.com. I talk about the detailed Emini price action real-time throughout the day in the BrooksPriceAction.com trading room. We offer a 2 day free trial.
When I mention time, it is USA Pacific Standard Time (the Emini day session opens at 6:30 am PST, and closes at 1:15 pm PST). You can read background information on the intraday market reports on the Intraday Market Update page.


I tend to believe that the upcoming presidential election could be a factor of the current market behaviour and that the outcome of the election might have a much higher impact on the markets than the Brexit referendum did.
I know it is still no reason to base trading decisions on, but rather acting on the volatility it might cause.
The most significant move in my trading career was when the republicans took control of congress in 1994. Look at 1995 and later.
This election is different. It does not matter who wins. The odds are that the 2 year TR is the Final Flag. It might take a year or 2 to start to reverse, but 1500 is a logical target.
Al,
Thanks so much for your detailed comments. You seem to identify all the possibilities of where things may go. Now we have to wait and see what happens. This is very exciting, thanks.