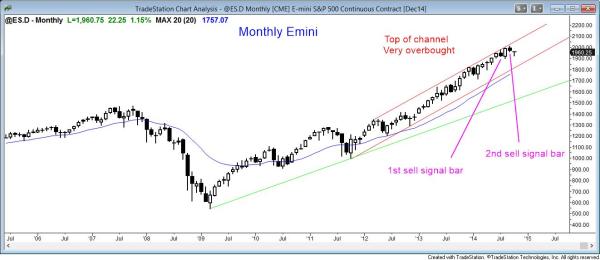
The monthly S&P500 Emini candle closed on Tuesday and created a bear reversal bar

The monthly Emini chart triggered a second entry sell signal this week by falling below last month’s low. It is too early to know what the entry bar will look like when it closes at the end of October.
The monthly Emini has been this overbought only three times in the past 20 years, and each of those prior times was followed by a reversal of at least 20%. When this week fell below last month’s low, the Emini triggered a sell signal on the monthly chart. It also did this in August, and that makes this current sell signal a second signal. This increases the chances that the bears will be able to create a pullback that lasts at least a few bars (months).
Since the monthly chart is in such a strong bull trend, the downside is probably limited. However, it should work its way sideways to down to the moving average, which currently is around 1800.
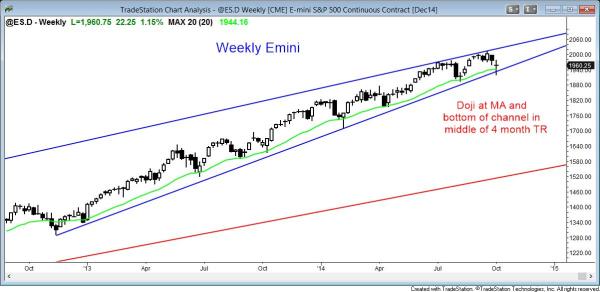
The weekly S&P500 Emini candle chart had bad follow-through selling after triggering a sell signal 2 weeks ago.

The weekly Emini reversed up sharply at the weekly moving average, but formed a doji bar in the middle of a four month trading range.
The weekly Emini chart fell below its moving average, but reversed up to close above the average. With its close near the open, the candle became a big doji bar. It is a trading range bar in the middle of a 4 month trading range.
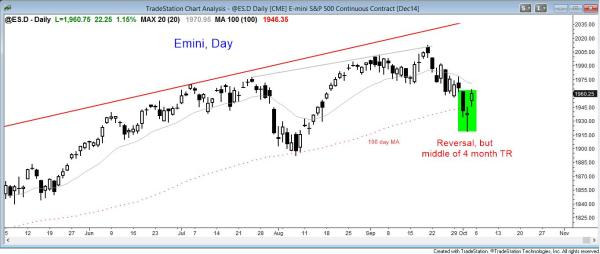
The daily S&P500 Emini candle chart had a bear breakout, but bad follow-through

The daily Emini reversed up sharply from a higher low and the 100 and 150 day moving averages, after closing two gaps in August on the daily chart.
Today completed a reversal of Wednesday’s strong bear trend. However, the Emini is in the middle of a 4 month trading range so the follow-through will probably be bad and result in more sideways trading.
Traders can see the end of the day bar-by-bar price action report by signing up for free at BrooksPriceAction.com. I talk about the detailed Emini price action real-time throughout the day in the BrooksPriceAction.com trading room, and a 2 day free trial is available.
When I mention time, it is USA Pacific Standard Time (the Emini day session opens at 6:30 am PST, and closes at 1:15 pm PST). You can read background information on the intraday market reports on the Intraday Market Update page.