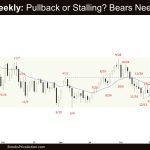
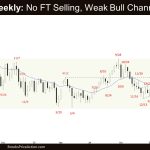
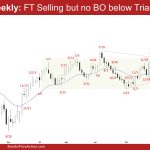
Market Overview: EURUSD Forex The weekly chart formed a EURUSD breakout below the triangle pattern and the small trading range. The bears need to create follow-through selling next week to increase the odds of a retest of the larger trading range low (October low). The bulls want a reversal from a higher low major trend […]
Crude Oil Pullback?
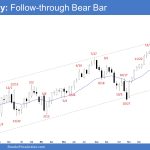
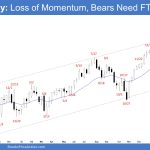
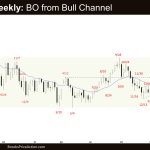
Market Overview: Crude Oil Futures The weekly chart formed a Crude Oil pullback, closing as a bear doji following last week’s breakout above the bull channel. The bears want a failed breakout above the bull channel and a reversal from a wedge pattern. If the market trades lower (pullback), the bulls want the 20-week EMA […]
Emini Consecutive Bear Bar
Market Overview: S&P 500 Emini Futures The weekly chart formed an Emini consecutive bear bar, something that has not happened since October 2023. The bulls want to get at least a small retest of the prior trend extreme high (Mar 21), even if it only leads to a lower high. The bears need to continue […]
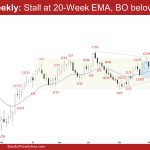
Emini Overlapping Price Action
Market Overview: S&P 500 Emini Futures The weekly chart indicates a loss of momentum since February with the Emini overlapping price action. Traders will see if the bears can create follow-through selling following this week’s bear bar. If a pullback begins, the bulls want it to be sideways and shallow, filled with bull bars, doji(s) […]
Stronger Crude Oil Buying Pressure
Market Overview: Crude Oil Futures The bulls managed managed to create consecutive bull bars closing near their highs which means stronger Crude Oil buying pressure. They want a retest of the trading range high (Sept 28). The bears need to create consecutive bear bars closing near their lows to convince traders that they are back […]
No EURUSD Breakout below the Triangle
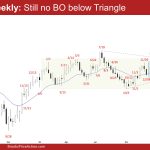
Market Overview: EURUSD Forex On the weekly chart, there was still no EURUSD breakout below the triangle. The bulls want a reversal from a double bottom bull flag (Feb 14 and Apr 2) or a wedge bull flag (Dec 8, Feb 14, and Apr 2). The bears hope that this week was simply a pullback […]
Crude Oil Bull Leg
Market Overview: Crude Oil Futures The weekly chart is in a persistent bull channel which could be the start of the Crude Oil bull leg to retest the trading range high. The bears will need to create sustained follow-through selling closing below the 20-week EMA but they have not yet been able to do so. […]
Emini 6-Bar Bull Micro Channel
Market Overview: S&P 500 Emini Futures The monthly chart formed an Emini 6-bar bull micro channel which means strong bulls. Odds slightly favor buyers below the first pullback. The bears want a failed breakout above the all-time high and a reversal from a higher high major trend reversal. While a minor pullback can come at […]
EURUSD Consecutive Doji
Market Overview: EURUSD Forex The monthly chart formed a EURUSD consecutive doji in the middle of the trading range. The market is in an area of balance. The bulls want the 20-month EMA or the bull trend line to act as support. The bears hope that March was simply a pullback which formed a lower […]
Emini Breakout above the ioi Pattern
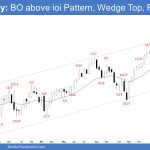
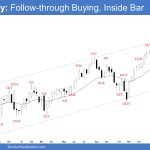
Market Overview: S&P 500 Emini Futures The weekly chart formed an Emini breakout above the ioi pattern. The bulls need to create follow-through buying to confirm the breakout above. The bears hope that the sideways tight trading range (the ioi pattern) will be the final flag of the rally. S&P500 Emini futures The Weekly S&P […]