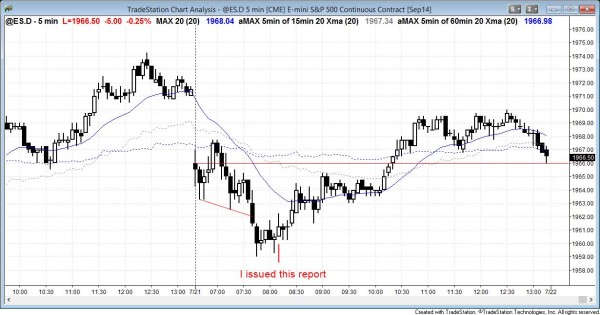
I posted this chart after the close. Today sold off to a parabolic wedge bottom just above yesterday’s low, but the selling lacked consecutive big bear trend bars. This made the selloff more likely a bear leg in a trading range rather than in a bear trend. Also, since yesterday (Friday) was such a strong bull trend day, today was likely to be a trading range day and not a bear trend day. The bulls took control on the 8:30 am bull reversal and breakout and the Emini and stock market rallied to another new high of the day. After reversing down on the second barn then going to a new high, then a new low, and finally a new high, the day was clearly a trading range day that would probably close near the open, which it did.
Posted 8:08 am PST.
The most important price action in today’s intraday update is the bear trend reversal down after yesterday’s strong bull trend. Since yesterday was a strong bull trend, the odds favored a pull back and a transition into a trading range today. The selloff so far has had weak follow-through and more likely will be followed by a reversal up from around yesterday’s low and then a trading range, and a test back to the open of the day. The 1960 level has been both support and resistance for several days, and unless the market breaks strongly below it, the market will probably rally from this area again today. It might first break below yesterday’s low. Bulls need either a strong reversal up or a stronger bottom. Less likely, the day will be a bear trend day.
The 60 minute chart is in a two week trading range at the top of the weekly channel. The market has about a 2/3 chance of testing below 1900 over the next month or two. The S&P500 is deciding whether to first have a bull breakout of the weekly bull channel, which usually soon fails, or to correct to the bottom of the channel around 1900 without first getting the bull breakout. There is about a 1/3 chance of a successful bull breakout and an accelerated bull trend.
See the weekly update for a discussion of the weekly chart.
Traders can see the end of the day bar-by-bar price action report by signing up for free at BrooksPriceAction.com. I talk about the detailed Emini price action real-time throughout the day in the BrooksPriceAction.com trading room, and a 2 day free trial is available.
When I mention time, it is USA Pacific Standard Time (the Emini day session opens at 6:30 am PST, and closes at 1:15 pm PST). You can read background information on the intraday market reports on the Intraday Market Update page.