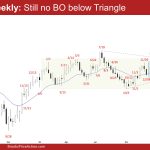
Market Overview: EURUSD Forex On the weekly chart, there was still no EURUSD breakout below the triangle. The bulls want a reversal from a double bottom bull flag (Feb 14 and Apr 2) or a wedge bull flag (Dec 8, Feb 14, and Apr 2). The bears hope that this week was simply a pullback […]
Stronger Crude Oil Buying Pressure
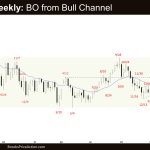
Market Overview: Crude Oil Futures The bulls managed managed to create consecutive bull bars closing near their highs which means stronger Crude Oil buying pressure. They want a retest of the trading range high (Sept 28). The bears need to create consecutive bear bars closing near their lows to convince traders that they are back […]
Emini Overlapping Price Action
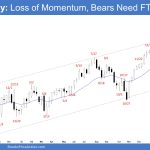
Market Overview: S&P 500 Emini Futures The weekly chart indicates a loss of momentum since February with the Emini overlapping price action. Traders will see if the bears can create follow-through selling following this week’s bear bar. If a pullback begins, the bulls want it to be sideways and shallow, filled with bull bars, doji(s) […]
100 Nasdaq Sideways for Past 6 Weeks Since 2-26
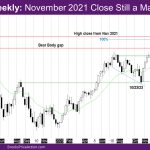
Market Overview: NASDAQ 100 Emini Futures The NASDAQ Emini futures week is a doji bear bar with a longer tail below. The market has been sideways for past 6 weeks since 2-26. On the daily chart, the market has been unable to close above the high close of March 1 at 18588.75. This will likely […]
DAX 40 Tight Bull Channel at Swing Targets, AIL
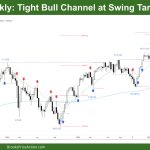
Market Overview: DAX 40 Futures DAX futures went down last week with some profit-taking after a tight bull channel. We are still always in long, but we raced past 18000, and we might need to stop there for bulls to recover from the move up. It is an outside down bar, so a weak sell […]
FTSE 100 Bull Breakout, Outside Down at LH, AIL
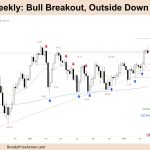
Market Overview: FTSE 100 Futures FTSE 100 futures went lower last week with profit-taking high in a bull breakout. Back at the highs of the trading range for the last 12 months, it looks like the bull trend is gathering momentum again for a new high. Bears argue for more trading range, but many sell […]
Nifty 50 Micro Double Top
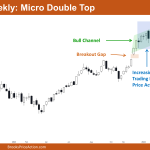
Market Overview: Nifty 50 Futures Nifty 50 Micro Double Top on the weekly chart. This week, the market formed a Micro Double Top, followed by a weak small bull doji bar. Currently, it’s trading within a bull channel, albeit a weak one. The price action within this channel resembles trading range behavior, indicating that traders […]
Emini Strong Bear Breakout on Daily
Trading Update: Friday April 5, 2024 S&P Emini pre-open market analysis Emini daily chart Emini 5-minute chart and what to expect today Yesterday’s Emini setups Richard created the SP500 Emini charts (Al travelling). Here are reasonable stop entry setups from yesterday. I show each buy entry bar with a green arrow and each sell entry […]
Emini Finding Support at the March 8th Breakout Point
Trading Update: Thursday April 4, 2024 S&P Emini pre-open market analysis Emini daily chart Emini 5-minute chart and what to expect today Yesterday’s Emini setups Richard created the SP500 Emini charts (Al travelling). Here are reasonable stop entry setups from yesterday. I show each buy entry bar with a green arrow and each sell entry […]
Emini Closed March 8th Breakout Point
Trading Update: Wednesday April 3, 2024 S&P Emini pre-open market analysis Emini daily chart Emini 5-minute chart and what to expect today Yesterday’s Emini setups Richard created the SP500 Emini charts (Al travelling). Here are reasonable stop entry setups from yesterday. I show each buy entry bar with a green arrow and each sell entry […]