The support forum is built with (1) General and FAQ forums for common trading queries received from aspiring and experienced traders, and (2) forums for course video topics. How to Trade Price Action and How to Trade Forex Price Action videos are consolidated into common forums.
Brooks Trading Course social media communities
Ok, I have decided onto the following conditions that have to be met, to allow myself to trade live again:
- Complete watching the BTC at least once.
- Starting with a Demo Account, funded with 1000€ virtual cash, trading the standard GER30, 1€ per point.
- Capital has reached a minimum of 1500€
I'm still thinking of a way to penalize falling under the margin limit. Of course, in the end I'll have to reset the account to 1000€ if I want to practice more. 😐
To the future Kristof reading this: Don't even think of bending the rules! Prove that you have learned and you will be allowed to trade live again!
“Farewell, Haladdin, and remember: you have everything you need to win. Repeat it as an incantation and don’t be afraid of anything. Now, take this… and turn away.”...
Nazgûl Sharya-Rana
After beeing up 200 points so far, I came to the realization, that I should not force myself to swing trade. Apparently my natural style is scalping and I have no problem with collecting the crumbs instead of the entire loaf of bread. If tight stops and small but many profits fit me, then I see no reason why I should not do what I'm best at. Appareantly I have some (limited) talent in spotting, when the market is about to turn, so I might just build on what I already know. Of course, Al is right when he says that most beginners have the problem of re-entering when scalping, but that's a problem I'm willing to work on.
With the live account, disaster struck whenever I tried to swingtrade and not so much when I just scalped as usual.
Dear all,
with this post, I want to give an update about my trading progress. In general, I have completed a lot more of the course and I feel how finally the puzzle pieces are coming together, forming a picture.
In the last months, I did not trade too much, as I wanted to progress in the course (see previous posts). The last weeks, I resumed trading tiny position sizes and it is going much better. Firstly, I open up a chart and in 90% of the times, I immediately see, what the market is doing and have an idea right away, if I can take a trade now, wait for a little time or just walk away from that market for a few hours. It's not really that I make that much better trades, but I finally manage to avoid all the bad trades I would normally have taken. Even so that most days I walked away with enough money to pay my lunch 😆 . Anyways, I did not post the individual results here, as I jumped back and forth between markets and timeframes and I took just very few trades per day. That's why I selected a trade from today just as an example, how different parts of the course did come together to allow for a good profit on this trade:
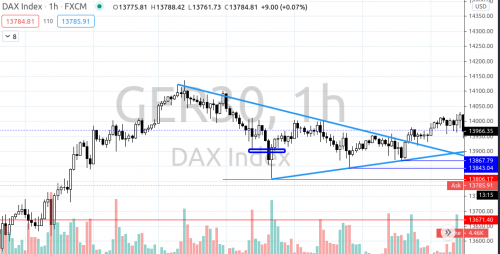
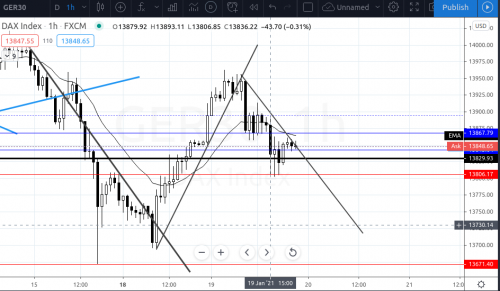
You can see the one hour chart of the German30 with some of my drawings. In general, I was looking to go short the previous days, but I was waiting for a plausible entry. As you can see, the market topped out and then went lower, forming a wedge bottom. The reversal up looked weak so I looked for a signal to go short, considering it as LL, maybe MTR. So I entered on the last bar that is depicted (that big bear trend bar).
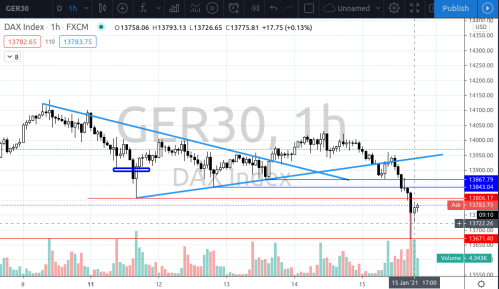
As you can see in the second chart, the market tested the high of the trend bar and then resumed downwards. Hesitating at the prior wedge low, it eventually broke lower. At this point, I was looking at possible targets. Then, I remembered that Al stressed the importance of higher timeframe S&R on the weekly chart when trading on friday. So I drew in some weekly levels and managed to exit exactly at the LOD on the 13'670 handle. As you might imagine, this is incredible progress for me! You can also see how different parts of the course material come together to give the entry, the SL levels and the exit. Only the information about the weekly support level transformed this trade into a trade with about 41% ROIC instead of a trade with 10%, combined with the information about exhaustive moves (biggest bear bar late in bear trend, MM target, second leg etc).
I also noticed that very often different concepts from the course lead to the same results, i.e. it does not matter if I consider a certain pattern a MM, second leg, magnet from support below etc.
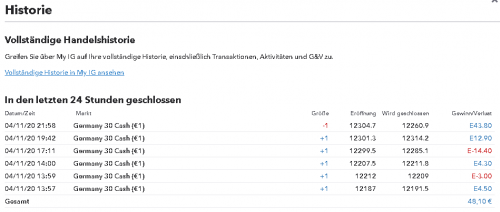
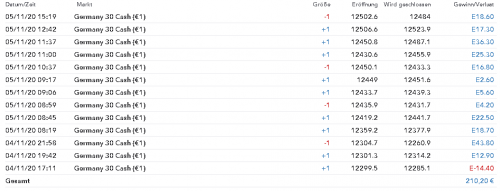
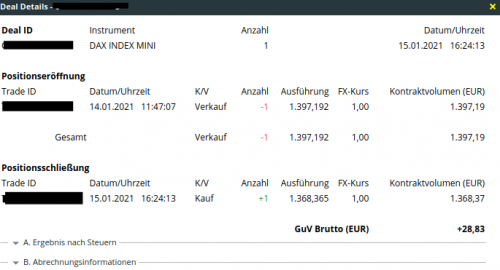
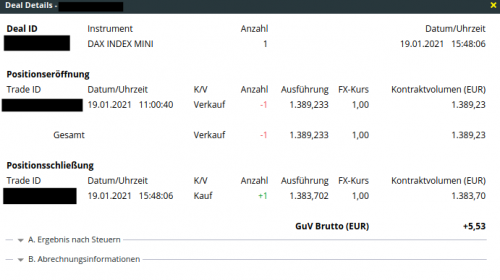
So anyways, just wanted to share this with everyone. I'll attach the broker statements for credibility. Please note that I traded the "mini-Dax", so one contract in the mini-Dax equals one tenth of the normal Dax contract. 🙂
What a perfect textbook-like setup!
Today, I was again trading the hourly chart of the Ger30. As you can see from the picture, there was a very strong two-legged bull moved the day before. As it was fairly climactic without pullback, I was looking for a setup to short. At the time, I was only looking for a scalp, as the first reversal is usually minor and the bull trend was exceptionally strong. The first candle after the open was a very strong bear trend bar. This got me thinking, if this could be a possible swing-trade. I waited for another bar and sold the close of the bull bar right after the big trend bar, as I was looking for at least another leg down, since the bear breakout was that strong. After some consolidation, the market broke down for a perfect measured move, where I took profits.
It's really incredible, how perfect the setup and the move looks like!
Finally a breakthrough!
This has been a very good trading week for me - I managed to achieve a ROIC of around 106% trading the GER30. Some major facts, that I feel like contributed to this result:
- I traded the 1 hour chart. Less overtrading, more time to do the analysis.
- I was doing something else in the meantime. So I only looked at the chart every 30 minutes or so. This helped with patiently waiting for setups and also riding the winners.
- I progressed further in the course material. Especially the section about Support, Resistance, and Basic Patterns was the point where a lot of things clicked into place. Whenever I look at a chart, I very clearly see what the market is doing. So far so, that I'd say that in 70% of the time I'm able to anticipate moves in the market a few hours before they happen. This is enough time to prepare for the trade. I'm much calmer, as I anticipate the move and just have to wait for the signal bar.
- I only trade based on "closed" candlesticks, i.e. I only base trading decisions upon completed candlesticks. In former times, I did some trades based on candlesticks that where still in formation. Most of the times, that was a bad idea (false breakouts). I deem this to be one of the biggest improvements.
All in all, I have to say that I'm very happy that I'm making progress. However, I'm also afraid that this result is only a statistical outlier and next week will be bad again. But I was able to do this once. Why not again and again?
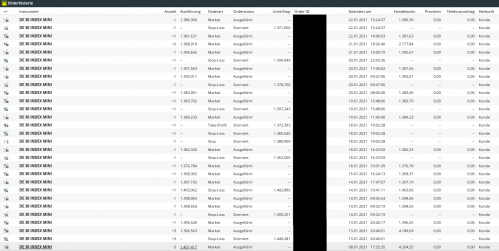
Here are all the trades and the brokers statement for credibility. As always, please note that I'm trading the Mini-Dax (1 Mini-Dax point = 10 Dax points):
Cumulative P/L: 106% ROIC / 736 Dax points
Hi all,
I'm just giving a quick update about my progress, in case anyone is interested. I have now completely worked through the first part of the course and I just started the second part. I really have to say that - again - so many things clicked into place and my attitude towards trading is improving as well.
I did set up a Cent account and an account that allows me to trade 0.01 lots. This really helps me because I can trade very small but still with real money. I can easily scale in, my account size is "big" enough for taking on trades where the stop is far etc. Much better! I'm really focusing on the "craft aspect" of trading: Getting in with a plan and logic, looking at the traders equation, managing the trade correctly and just practicing and practicing and practicing - getting rid of the bad habits. And who would have thought: Once you just do what Al says - it goes much better! For example, I finally lost that will to pick a perfect entry. I now know the basics of properly managing a trade and I'm just confident to take any reasonable trade - even the 5th close of a breakout. That was impossible for me for, well let's face it - 4 years? I'm really blown away that you can ACTUALLY, in 80-90% of the time, buy or sell and still make money with good management. I just see a reasonable trade, make a plan, enter it and then focus on managing. Lot more conficende and just being chilled in front of the computer.
So yes, I can really feel the progress from the psychological side of things. Now, I need to convert that into trading results eventually. But for now, I'm focusing on the trading itself and not on the money. Also, what helped me is to think more in percent, f.ex. I do not think "oh, I made 30 cents today (-> Cent account), but rather: "I made 9% today".
Best regards
Kristof
Hi all, I want to share my method of keeping a trading journal and creating a useful database, that I've found very helpful. Maybe you can find some use in it...
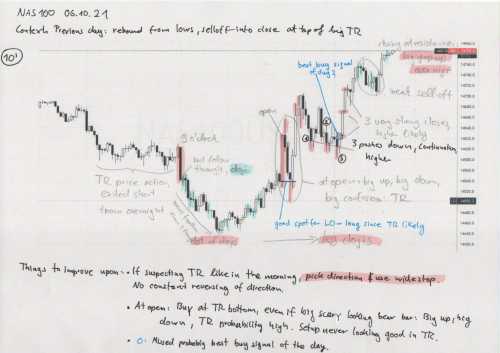
Firstly, for every trading day, I print out the chart and by hand, write down everything that comes to my mind, marking things etc. Below is just one possible example. Since I struggled yesterday in the NAS100, I have added more comments than on a day, where everything went perfectly. By doing this, I'm building my own database of charts that I have traded and where I have my own commentary, that is relevant for myself. For example, I'm currently focusing on being able to switch from LOM-Mindset to SOM-Mindset, since I'm either to slow or to fast in switching from TR-Trading to Trend Trading. That is reflected in the commentary.
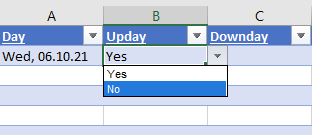
While this is certainly useful, I'm not that eager to go through hundreds of pages of charts, when I'm looking for specific price action patterns. That's why I also have an Excel sheet that attempts to summarize the price action of the day (click to open with full resolution!):
In there, I have the various categories like TR-day, Trend day, and also a wide selection of dropwdown options, in order to try to describe the trading day in a manner, that is useful for a database.
For example, I want to see all my charts where: A TR transformed into a Trend after a Gap down, we also a have a bear flag, overall, it was an up-day and I struggled with trading. Normally, you would be totally lost searching for this specific constellation in the standard hand-written journal (at least I always did). But with Excel, I just set those criteria as filters at the top of the tabulary and it spits out all matching dates. Then, I go to the big folders in the office and can easily find the relevant chart(s) that are sorted by date.
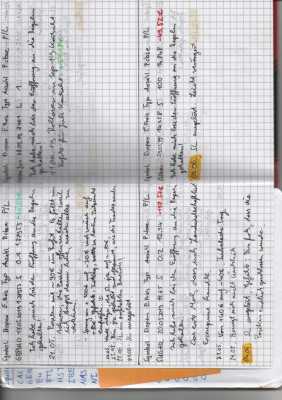
For myself, I'm finding this approach a lot better than what I did in the beginning; namely having a notebook where I would write down P/L, how I felt during trading etc. I never ended up going back to those notes because they simply did not help me. With this system, I can get up early, see that the market is, for example, higher over night and overall, it looks like a TR and I can already start to search for matching charts and get a feel for what I can expect for the day. (Below you'll find an example page from my old trading journal, after 2 years of having started trading. Clearly not very helpful).
Maybe you find it useful. With this system, I'm always eager to keep my trading journal at the end of the day, because I'm actually finding it useful whereas in former times, I had to force myself to do the daily entry. Obviously, this entire system is appended by the usual PnL and trade list, but that is just done the regular way, either directly onto the same chart printout or separately.
Regards, Kristof
Hi Kristof,
I am a big fan of your trading journal. Keep up the great work you are doing!
Hi all,
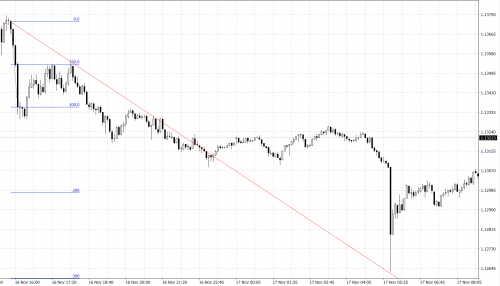
hope you're doing well! I saw some interesting overnight action in the EUR/USD, thought it might be interesting to see.
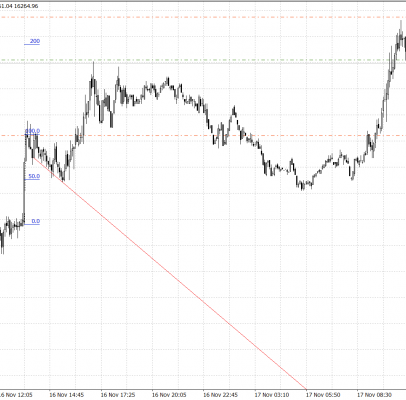
During the day, the MM target was not reached, and during the beginning asian session, the market traded mostly sideways before taking a plunge and overshooting almost to the 300 retracement before quickly reversing upwards. I was short with TP to the MM target, so I could profit on that. I had also placed a buy limit slightly below, but the SL was to close, so I gave back half of the profit from the initial short trade. This is one of the times where a limit pullback order could have been useful.
Addendum: A similar pattern happend overnight for the DAX, a MM target was not reached, we traded down during the night to then quickly move and reach the target in the morning, before entering a consolidation at that level:
Starting to see these patterns more often, now that I have my extended chart pattern trading journal.
