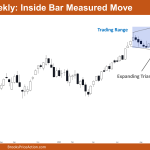
Market Overview: Nifty 50 Futures Nifty 50 Inside Bar Measured Move on the weekly chart. This week, the market gave a small bull close, and it is currently trading within the expanding triangle and the trading range. The market is moving closer to the inside bar measured move after the weekly chart of the Nifty […]
Nifty 50 Trading Range
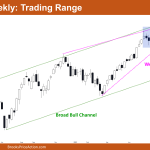
Market Overview: Nifty 50 Futures Nifty 50 Trading Range on the weekly chart. The market on the weekly chart gave a weak bull close (due to the tail at the top) this week. After a failed bear breakout attempt that received no follow-through, the market has once again entered the trading range. Bears have also […]
Nifty 50 Failed Breakout
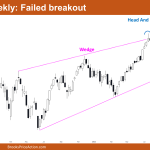
Market Overview: Nifty 50 Futures Nifty 50 Failed Breakout on the weekly chart. This week’s market produced a tiny bull close with a tiny body following two strong bear bars in a row, increasing the likelihood of a second leg down. A bear breakout of the head and shoulders top was also shown on the […]
Nifty 50 Wedge Top
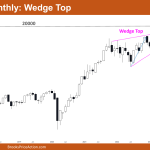
Market Overview: Nifty 50 Futures Nifty 50 Wedge Top on the monthly chart. The market continued to be in a wedge top breakout mode even after it provided a bear close for the October monthly bar. The big round number 20000 represents a strong resistance on the monthly chart that the Nifty 50 is trading […]
Nifty 50 Bull Channel
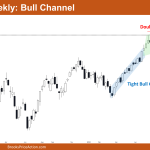
Market Overview: Nifty 50 Futures Nifty 50 Bull Channel on the weekly chart. The market is currently trading close to the bottom of the bull channel after forming a bull bar with a short tail at the top. After the double top reversal attempt, the bears were unable to change the trend. A bear reversal […]
Nifty 50 Spike and Channel Up
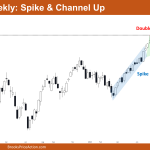
Market Overview: Nifty 50 Futures Nifty 50 Spike and Channel Up on the weekly chart. On the weekly chart, the market provided a bullish close with a long tail at the bottom, and it is currently trading close to the bottom trendline of the bull channel, suggesting that bulls may buy at the high of […]
Nifty 50 Wedge Top
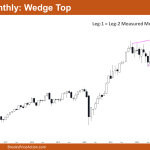
Market Overview: Nifty 50 Futures Nifty 50 Wedge Top on the monthly chart. This month, the market closed with a weak bullish candle and a long tail at the top. After the powerful bull leg, the bulls were unable to form a second leg. Bulls may have sold their long positions because the monthly chart […]
Nifty 50 2nd Leg Trap
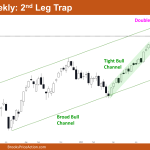
Market Overview: Nifty 50 Futures Nifty 50 2nd Leg Trap on the weekly chart. This week, the bears were able to obtain a strong bear close; however, a reversal will require a strong follow-through bar. Many bulls would be dissatisfied and postpone purchasing this bull breakout until the market once more gives a strong close […]
Nifty 50 Double Bottom
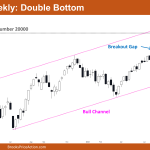
Market Overview: Nifty 50 Futures Nifty 50 Double Bottom on the weekly chart. On the weekly chart, the market is currently trading inside a large bull channel. This week, the market formed a strong bull close that resulted in a breakout of the important round number 20000. Bulls were able to obtain a breakout gap, […]
Nifty 50 Bull Flag
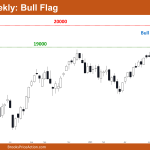
Market Overview: Nifty 50 Futures Nifty 50 Bull Flag on the weekly chart. On the weekly chart, the market formed a strong bull bar following an unsuccessful attempt at a reversal. Bulls gave a bull breakout of the bull flag, and based on the height of the bull flag, this could cause a measured move […]