The support forum is built with (1) General and FAQ forums for common trading queries received from aspiring and experienced traders, and (2) forums for course video topics. How to Trade Price Action and How to Trade Forex Price Action videos are consolidated into common forums.
Brooks Trading Course social media communities
Brooks Trading Course Learning Resources >>>

Starting a new thread for Nifty 50 setups. Had been posting the same before but under 'banknifty'' head. Will continue here instead
Date - 27.01.2025


Hello, I am kind of deviating from this thread and wanted insights on high 1/high 2 and low 1/low 2 concepts. Bar counting as per Al's method is important tool for entering the trend. As per Video 9A, traders will go long in bull trend whenever in "bull flag", high of current bar (H1) goes above high of prior buy. The traders go log with stop entry 1 tick above bar of H1.
Also as per Al's "Glossary of terms" high 1 (and 2, 3, 4) is a bar with a high above the prior bar in a bull flag or near the bottom of a trading range. If there is then a bar with a lower high (it can occur one or several bars later), the next bar in this correction whose high is above the prior bar’s high is a high 2. Third and fourth occurrences are a high 3 and 4. A high 3 is a wedge bull flag variant.
So essentially the sequence is - Bull trend > PB (in form of one or many bars) > First bar (can be bull or even bear bar) whose high goes above prior bar (in PB), it is High 1. High 1 is triggered when next bar (no necessarily immediate next bar) goes above high of this High 1 bar.
Now, in Video 9A (Slide 21; around 33 mins), while explaining this concept, Al calls a bar with tail on top also a high 1 with traders looking for going long by placing stop order one tick above high of this bar with tail on top.
Finally can we say -
Market is in bull trend; Any reversal attempts will fail and therefore traders look to go long 1 tick above any of the PB bar. This PB bar can be bear bar, bar with tail on top.

I would just add, entering or not entering on H1/H2 or L1/L2 is to basically to see if pullback is strong enough to lead to reversal or trading range or it is weak and trend will continue, it is comparing the strength of the trend with the strength of pullback and also to see if there are any trapped traders.
Nifty 28-Feb-2025
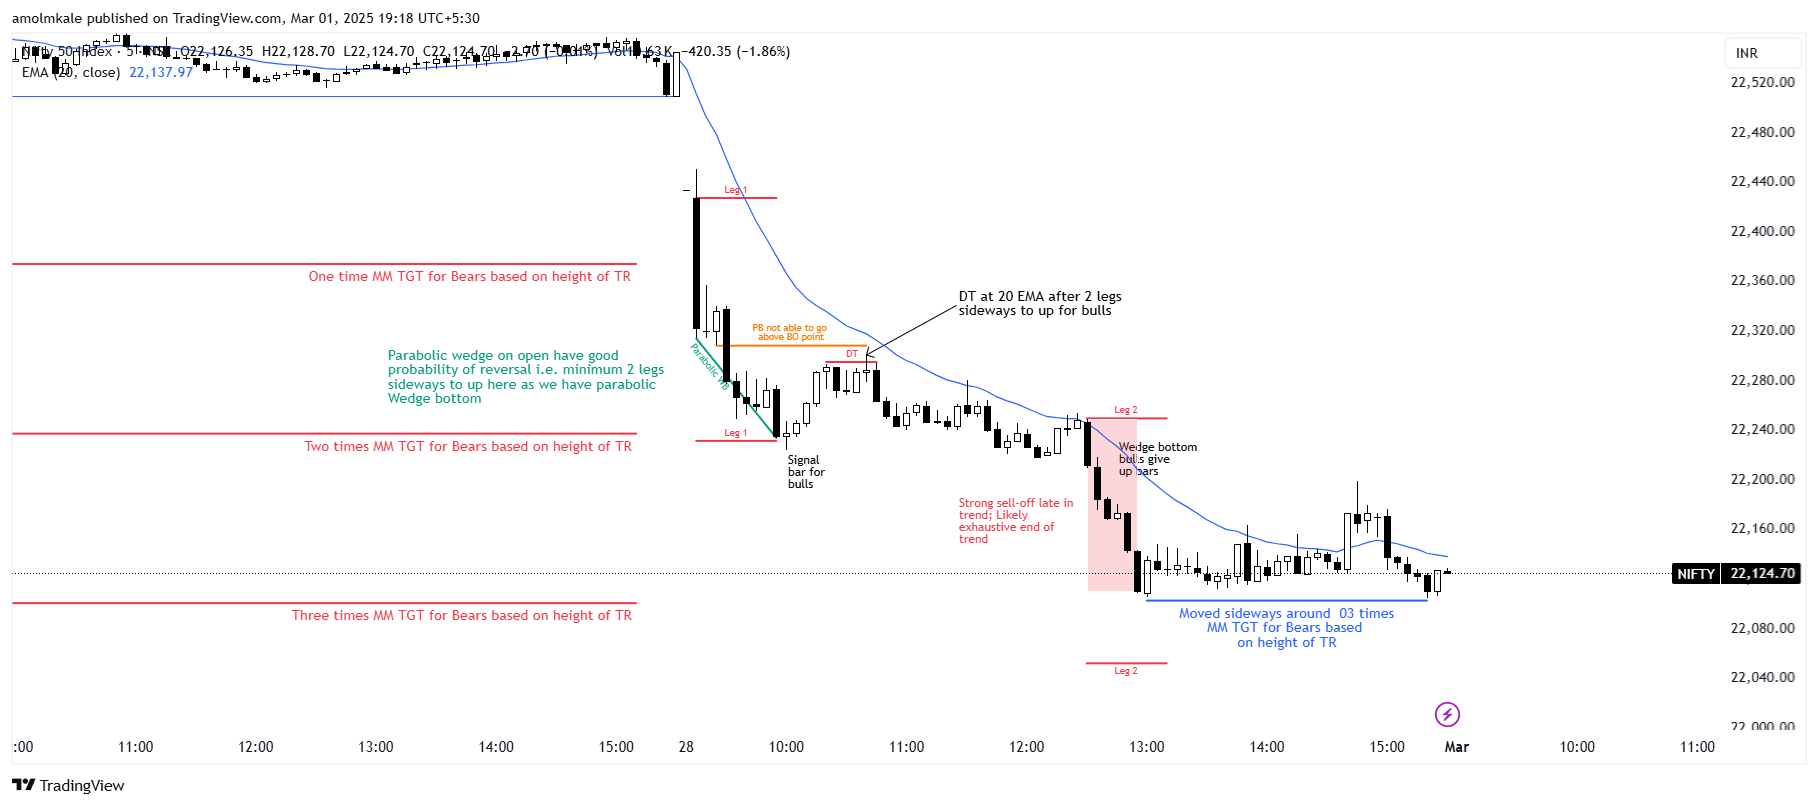

He is probably talking about an implied pullback or implied High 1
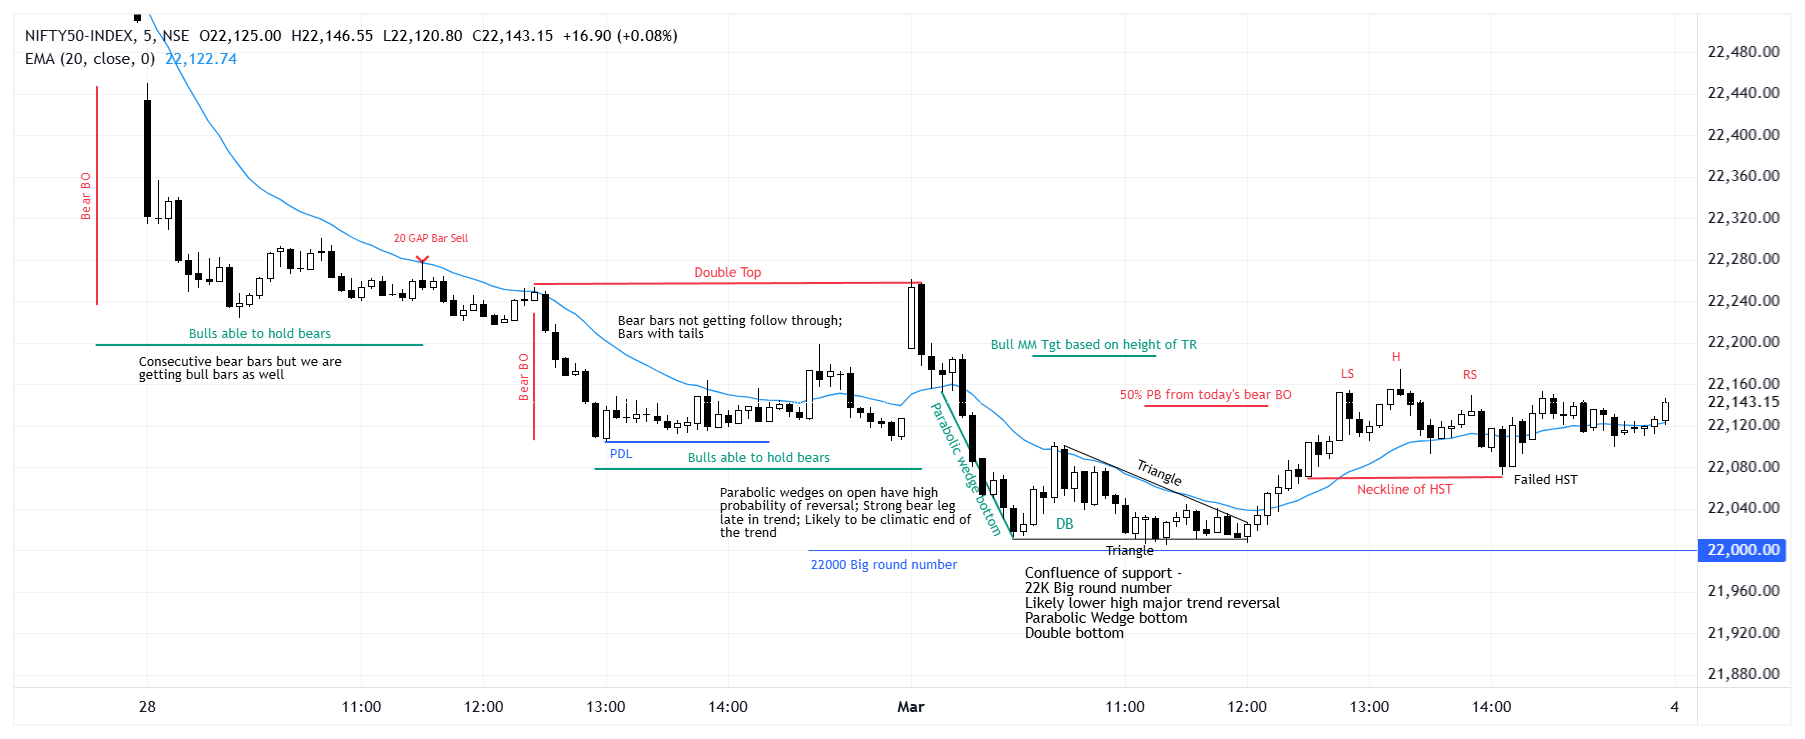
Nifty 03-Mar-2025
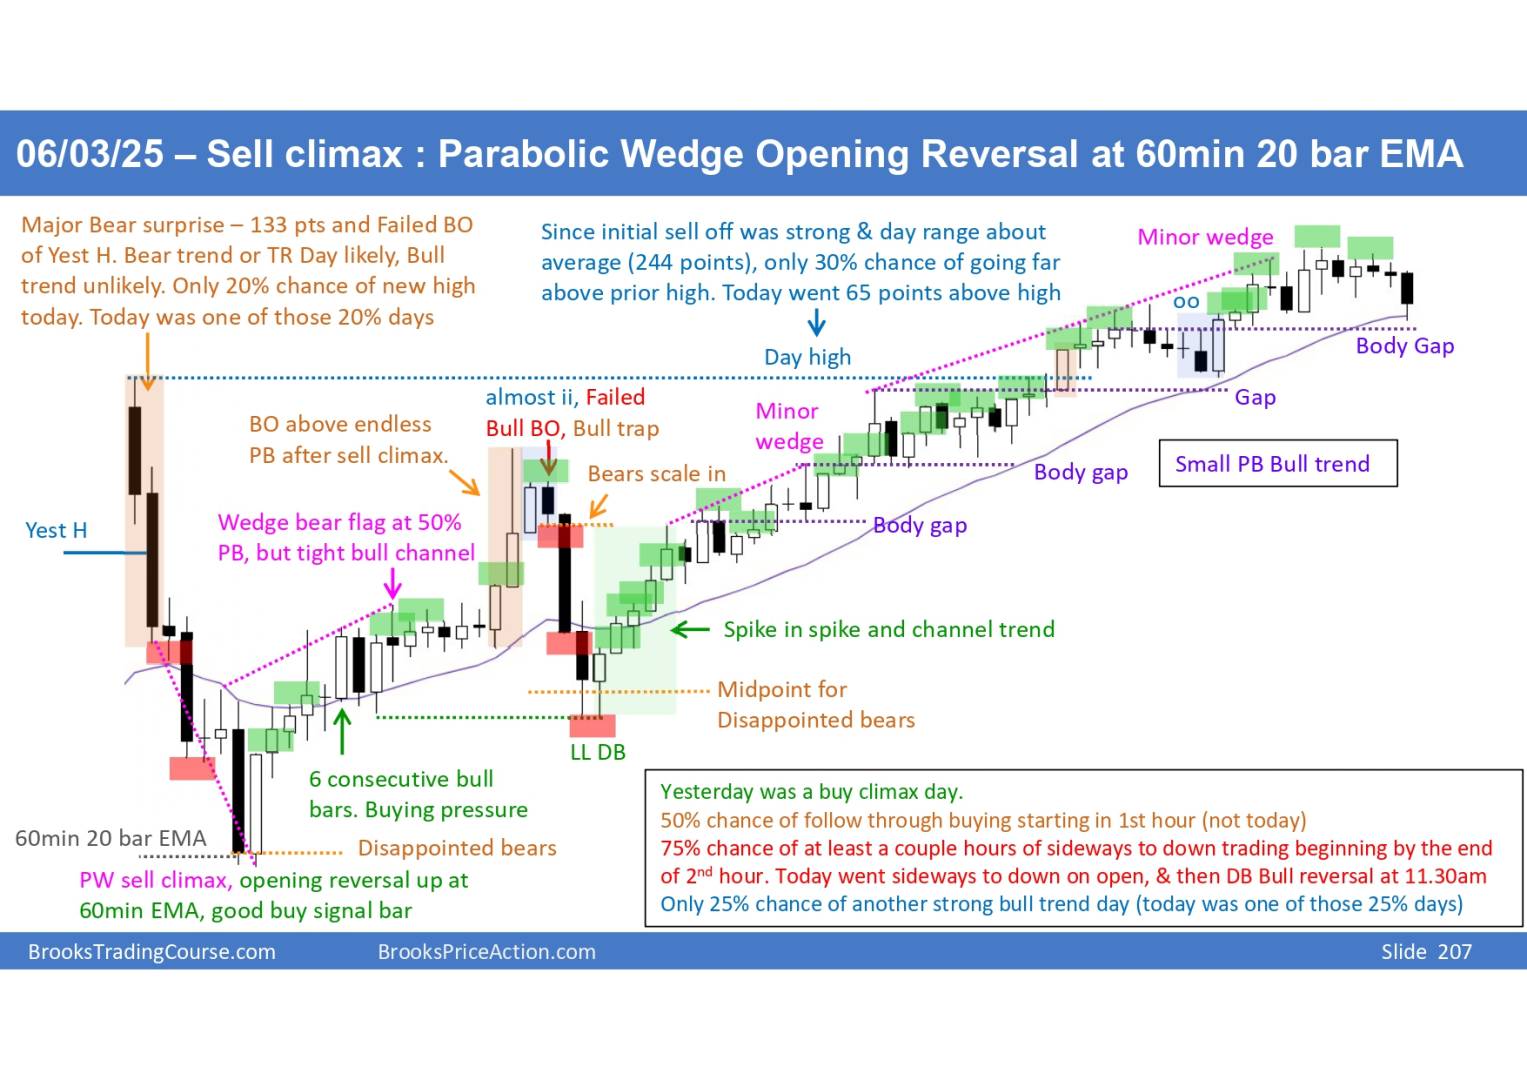
Nifty 50 daily setup 06/03/2025
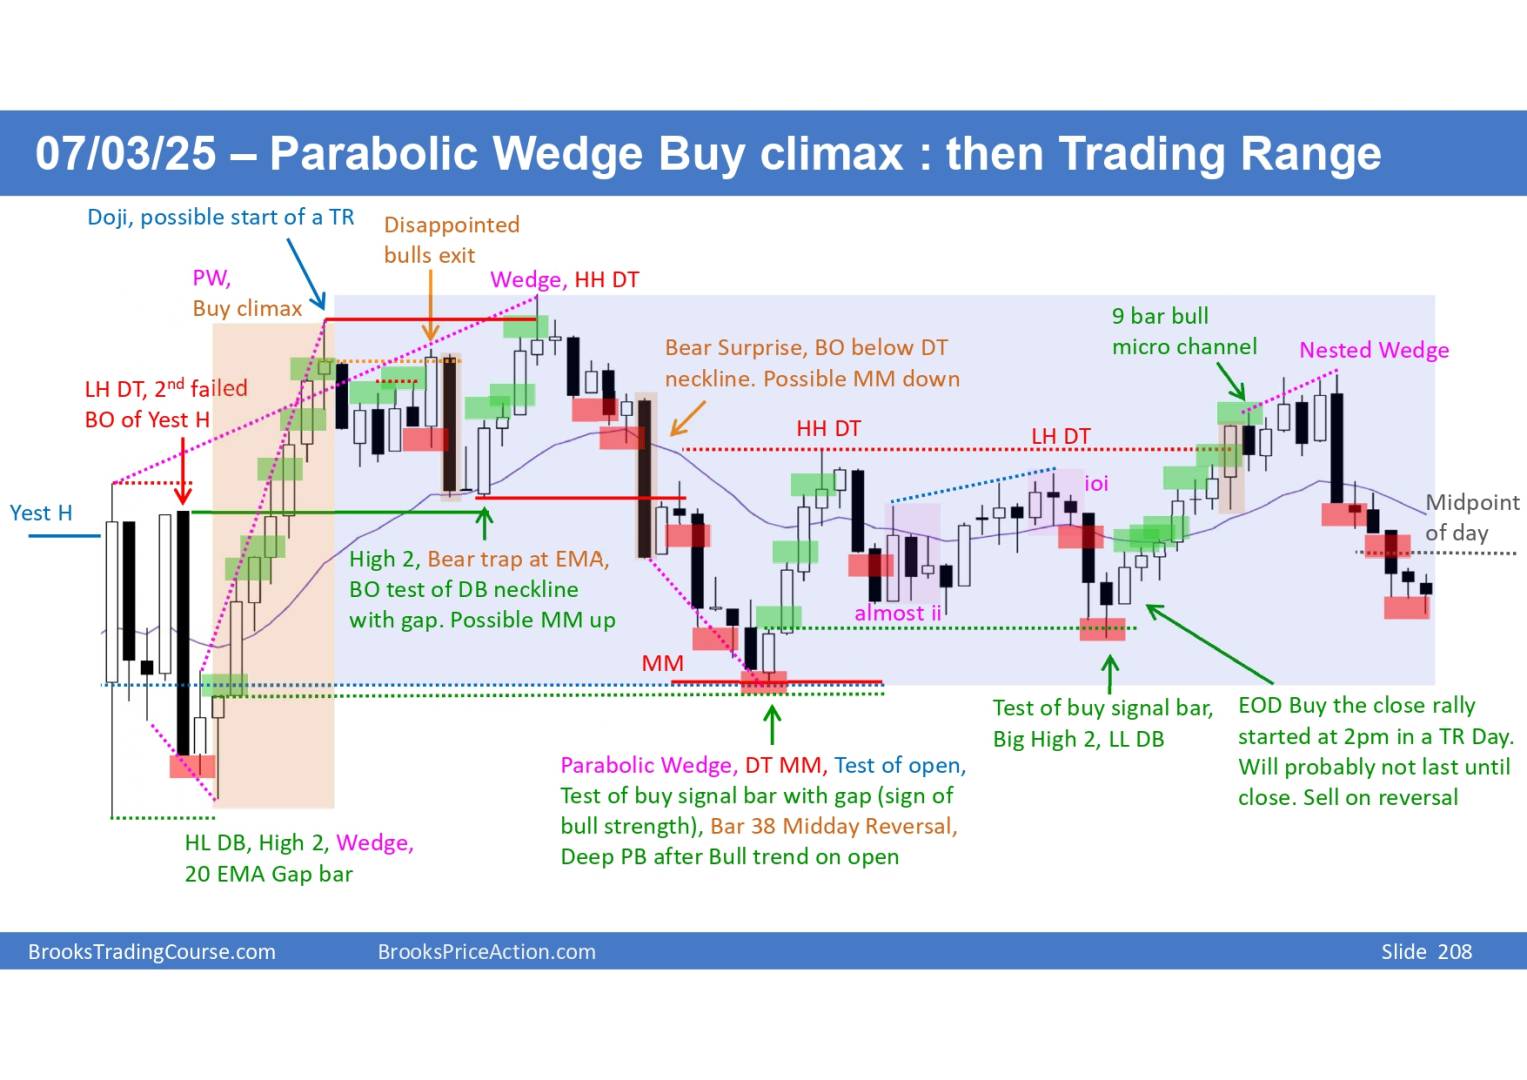
Nifty 50 daily setup 07/03/2025
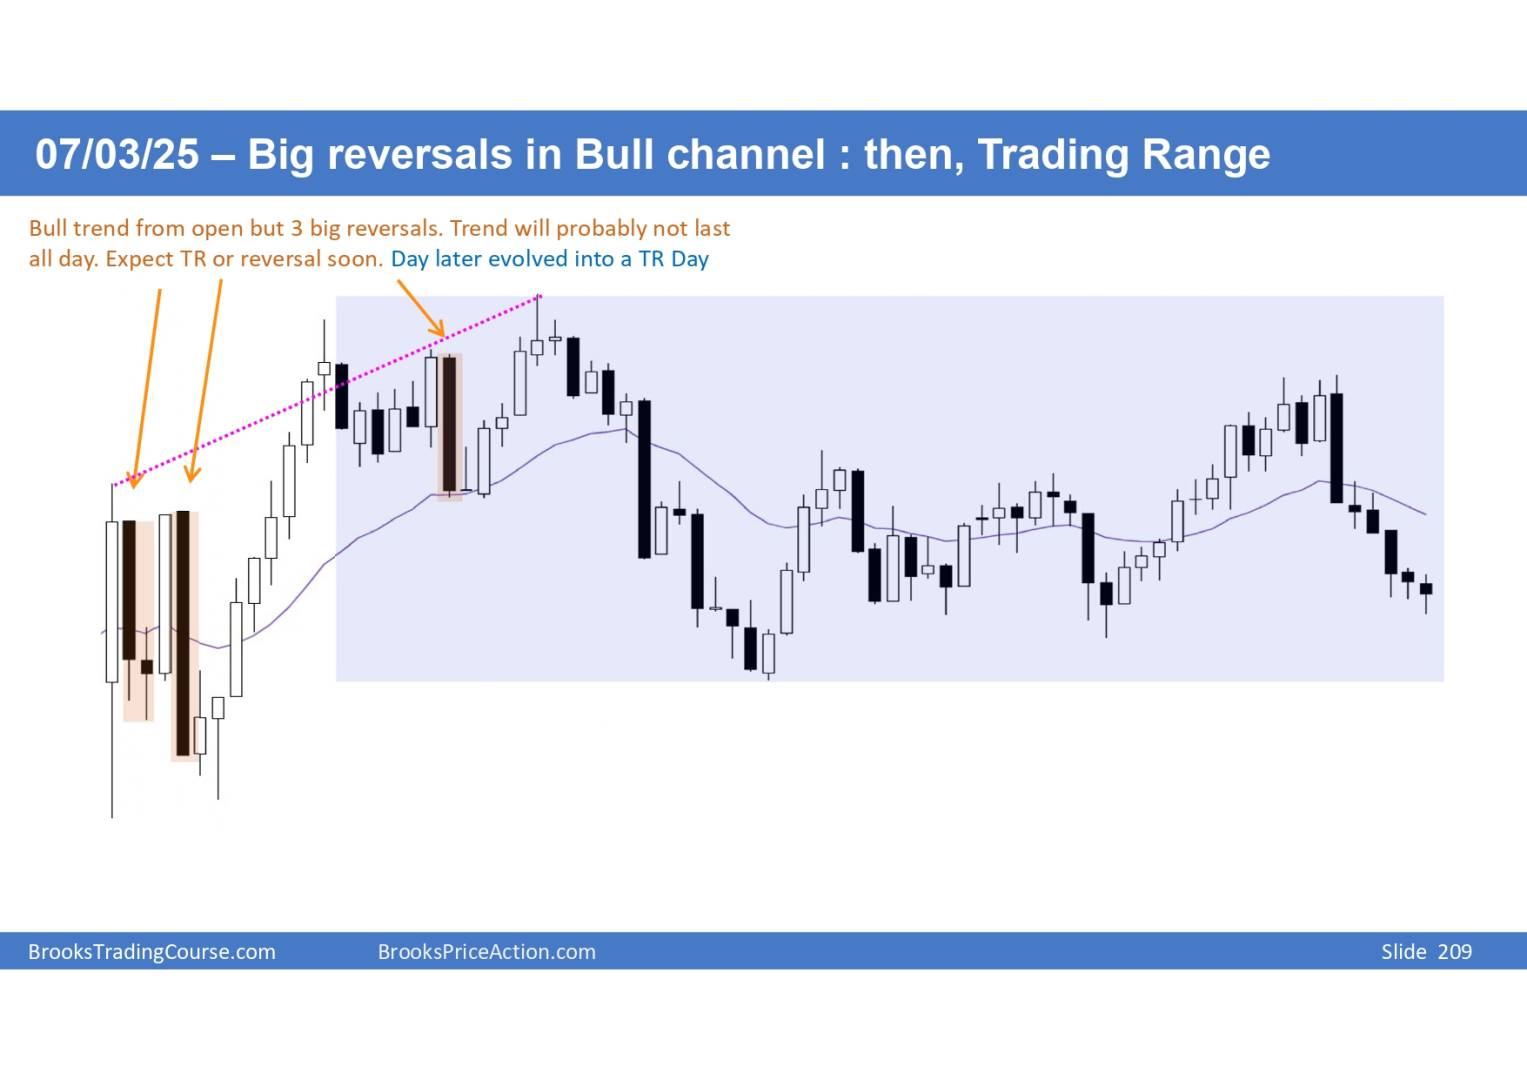

Hi darpan, could you plz post you screenshot from 15/02/2025 to 04/03/2025 because you are not there those time.
Thanks a lot for replying! 😊
Nifty 50 daily setup 10/03/2025


10-Mar-2025
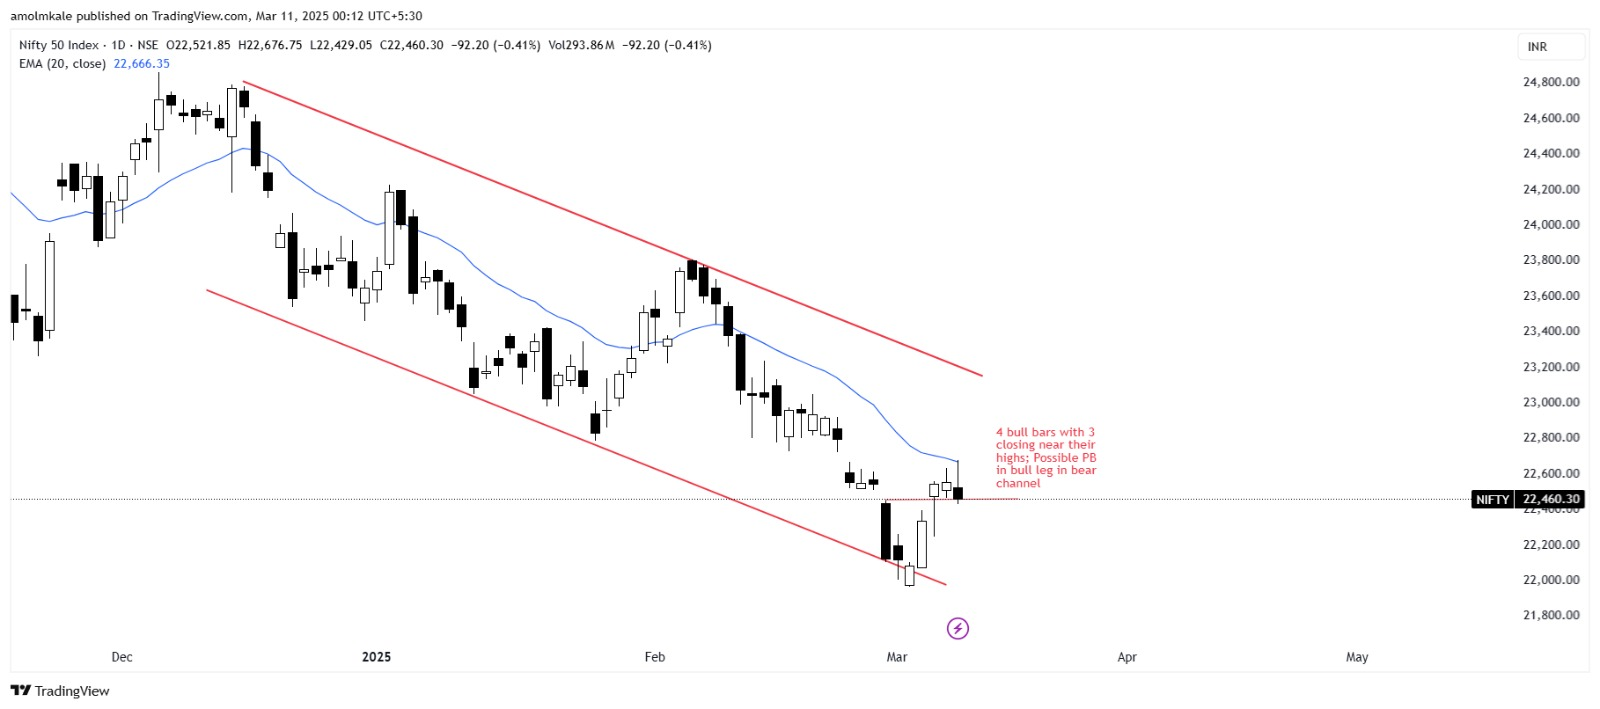
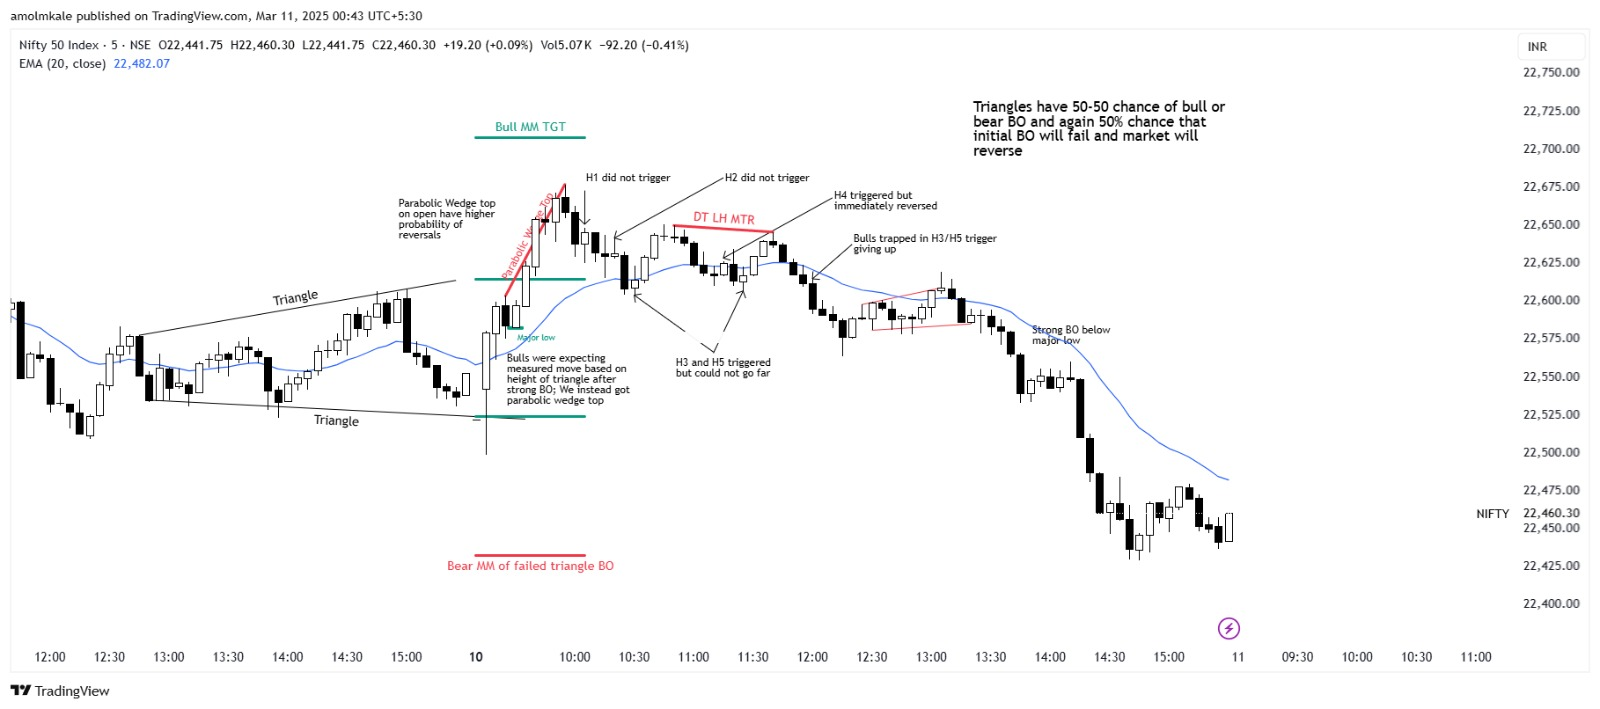
Nifty 50 daily setup 11/03/2025
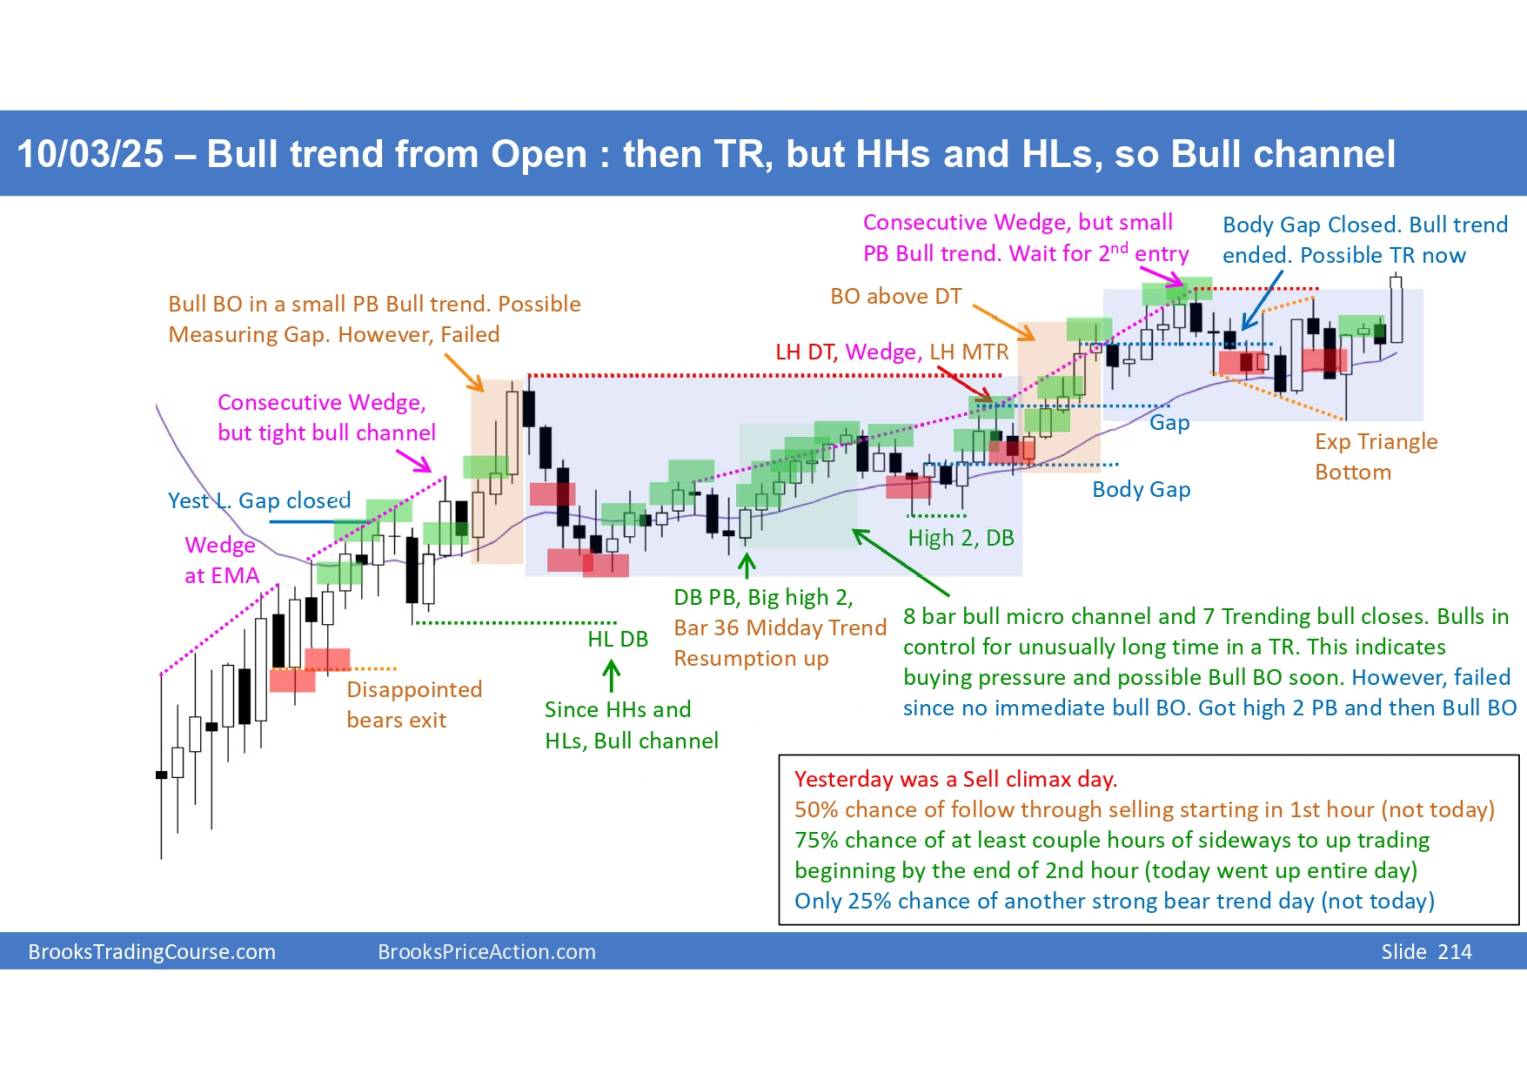
Thanks Darpan for the sharing daily chart! I know it can be difficult but whenever you have time, can you please give insights on identifying H1/H2/L1/L2. It will help if you can share example on chart.
Thanks in advance!
Cheers,
Amol

Could you share which chart and which bar are you having trouble identifying. I basically consider every 2nd attempt to reverse up as High 2 and 2nd attempt to reverse down as Low 2.

Thanks Darpan for taking time to review my charts! Could you please look into chart below, I have tried to identify H1, H2,...
Basically 10-Mar-2025 Nifty chart
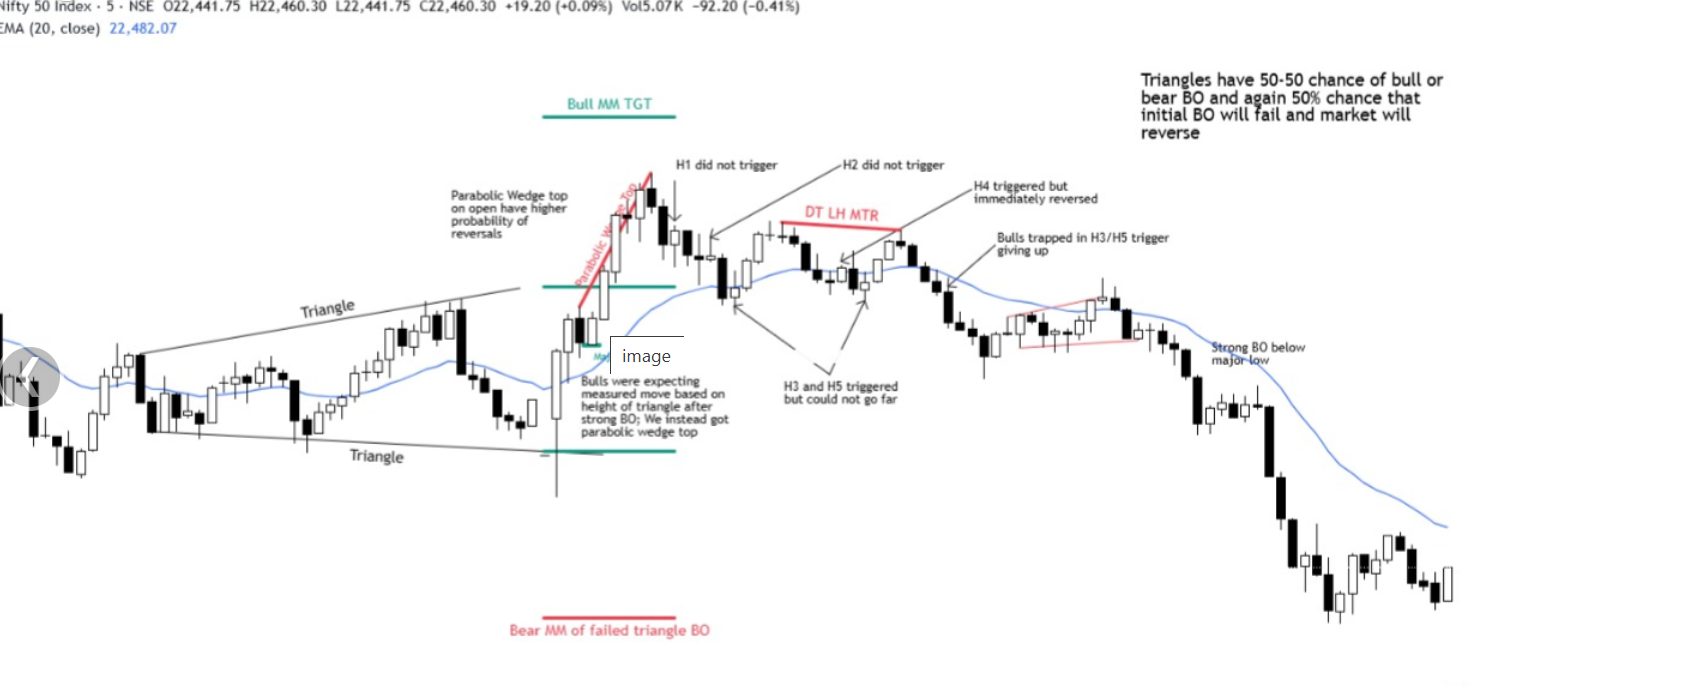
Hi, your identification of H1,2,3 was correct, but not H4,5. There was a rally after H3 and that would reset the count. H5 in your chart was actually a Nested High 2 considering pullback from Day high
Nifty 50 daily setup 12/03/2025


Hi Darpan/Amol, is there any trading room for Nifty? just like Emini, if so please mention.
I am into this course and like Al Brooks methods, also completed all the videos almost twice, just wanted have a regular discussion on setups and topics.
Having a trading room similar to Emini would be of great help.
Regards,
Nethaji
Hi Nethaji
As of now, we don't have a dedicated trading room for Nifty 50 but that's a great idea. I'll reach out to the admin over mail and check if we can set one up. Ill keep you posted if there's any update on this. Thanks for bringing it up!
Good Idea
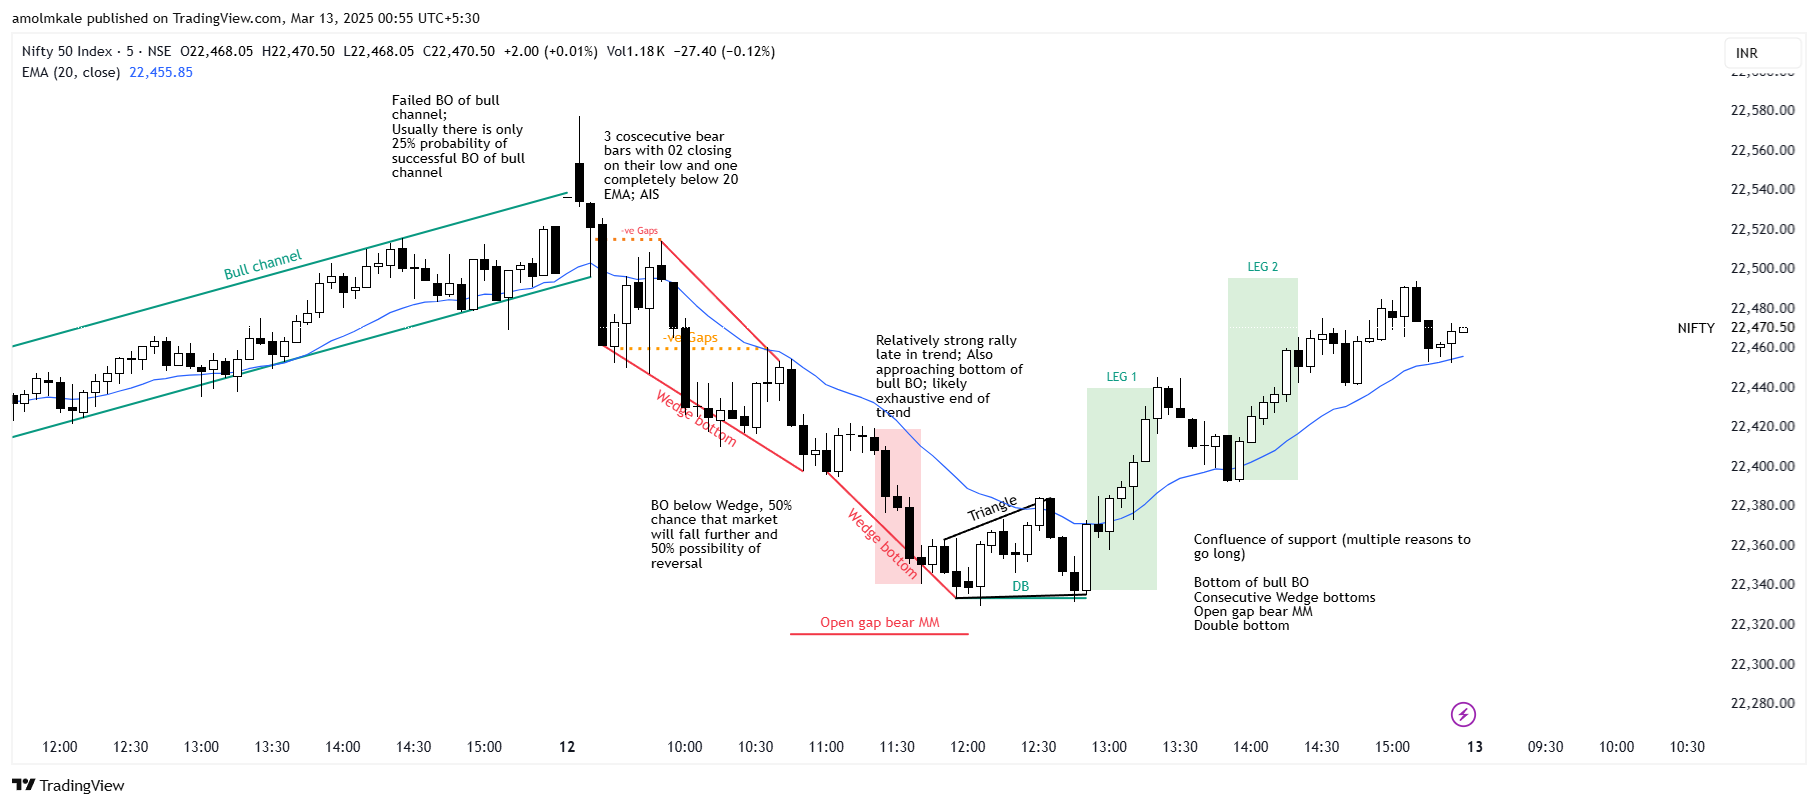
Nifty 12-Mar-2025
Nifty 50 - 18.03.25


Nifty 50 - 11.04.2025

Nifty 50 : 15/04/25 - https://youtu.be/zjwvlUmg5lw?si=P6ds7CVDHcMtruMO
Hey Traders!
I’ve just uploaded my very first video on Nifty 50 Live Intraday Analysis. Now, I’ll be honest – it’s a bit basic since it’s my first try, but I promise you’ll still find value in it! This is a step-by-step walk through of my real-time analysis. I’d love to hear any tips you have for improvement! Hope you'll like it

All the Best My Dear Darpan !
Thanks a lot Shankar ji, appreciate it!


