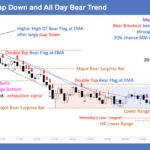
Trading Update: Tuesday July 14, 2026 E-mini end of day video review S&P E-mini market analysis E-mini daily chart E-mini 5-minute chart and what to expect today Yesterday’s E-mini setups Jed created the SP500 E-mini chart. Here are reasonable stop entry setups from yesterday. Chart shows each buy entry bar with a green arrow and […]
E-mini 5 Min – Gap Down and All Day Bear Trend
Trading Update: Monday July 13, 2026 E-mini end of day video review S&P E-mini market analysis E-mini daily anlaysis Friday’s E-mini setups Jed created the SP500 E-mini chart. Here are reasonable stop entry setups from last Friday. Chart shows each buy entry bar with a green arrow and each sell entry bar with a red […]
Bitcoin Transition into a 2nd Leg on Daily
Market Video Report: Bitcoin Duration 18:37 mins. Summary This week’s Bitcoin report examines weekly and daily charts to identify the Always-In Long flip, an Inside-Outside-Inside pattern acting as a bear trap, and the transition toward a second leg up (Leg 2), while outlining key upside targets and strategic risk management for stops and exits. Transcript […]
EURUSD ii Breakout Mode Pattern
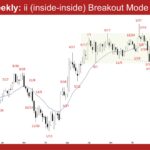
Market Overview: EURUSD Forex The market is forming a EURUSD ii breakout mode pattern on the weekly chart. Bulls want the low of the trading range to act as support. Bears want a strong breakout below the ii (inside-inside) pattern with follow-through selling. EURUSD Forex market The Weekly EURUSD chart The Daily EURUSD chart Market […]
Crude Oil Bears Want a Large Second Leg Sideways to Down
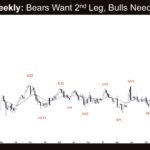
Market Overview: Crude Oil Futures Crude oil bears want a large second leg sideways to down. Bears want the 20-week EMA or the bear trend line to act as resistance. Bulls need consecutive bull bars closing near their highs to demonstrate control. Crude oil futures The Weekly crude oil chart The Daily crude oil chart […]
E-mini High 2 Buy Setup
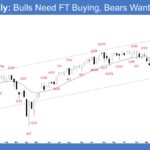
Market Overview: S&P 500 E-mini Futures This week triggered the Emini High 2 buy setup on the weekly chart. Bulls need sustained follow-through buying to increase the odds of a trend resumption. Bears want the June 15 high to act as resistance, forming a double top bear flag and a lower high major trend reversal. […]
Nifty 50 Triangle Pattern and Trading Range
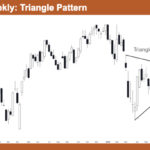
Market Overview: Nifty 50 Futures Nifty 50 Triangle Pattern and Trading Range. On the weekly chart, the market had a strong bull trend into the highs, followed by a sharp selloff, and it has since contracted into a triangle formed by a down-sloping upper trend line and an up-sloping lower trend line. This triangle is […]
Nasdaq 100 High3 Buy Signal After Bad High2
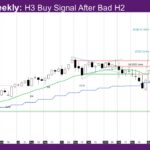
Market Overview: NASDAQ 100 E-mini Futures The NASDAQ E-mini futures week is a High3 buy signal after bad High2 buy signal last week. A High3 is the third attempt to resume the trend up. The daily chart is in a triangle around the daily EMA, with the range getting narrower. The monthly bar is an […]
Gold Sideways Market Builds Breakout Pressure
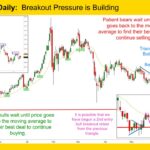
Gold GC-Mini Market Analysis The Gold GC-mini continues to tighten and build triangular breakout pressure. It is possible that daily bulls have already broken out of the prior triangle and now are retesting that breakout. Many traders will not buy the initial break out rather to wait for the 2nd entry retest. On the daily […]
E-mini Bulls Have Strong Buy Signal Bar inside of Triangle
Trading Update: Friday July 10, 2026 E-mini end of day video review S&P E-mini market analysis E-mini daily chart E-mini 5-minute chart and what to expect today Yesterday’s E-mini setups Jed created the SP500 E-mini chart. Here are reasonable stop entry setups from yesterday. Chart shows each buy entry bar with a green arrow and […]

