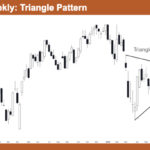
Market Overview: Nifty 50 Futures Nifty 50 Triangle Pattern and Trading Range. On the weekly chart, the market had a strong bull trend into the highs, followed by a sharp selloff, and it has since contracted into a triangle formed by a down-sloping upper trend line and an up-sloping lower trend line. This triangle is […]
Nasdaq 100 High3 Buy Signal After Bad High2
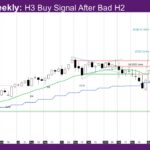
Market Overview: NASDAQ 100 E-mini Futures The NASDAQ E-mini futures week is a High3 buy signal after bad High2 buy signal last week. A High3 is the third attempt to resume the trend up. The daily chart is in a triangle around the daily EMA, with the range getting narrower. The monthly bar is an […]
Gold Sideways Market Builds Breakout Pressure
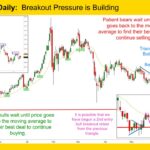
Gold GC-Mini Market Analysis The Gold GC-mini continues to tighten and build triangular breakout pressure. It is possible that daily bulls have already broken out of the prior triangle and now are retesting that breakout. Many traders will not buy the initial break out rather to wait for the 2nd entry retest. On the daily […]
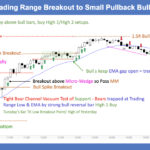
E-mini Bulls Have Strong Buy Signal Bar inside of Triangle
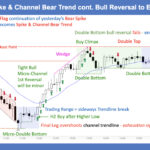
Trading Update: Friday July 10, 2026 E-mini end of day video review S&P E-mini market analysis E-mini daily chart E-mini 5-minute chart and what to expect today Yesterday’s E-mini setups Jed created the SP500 E-mini chart. Here are reasonable stop entry setups from yesterday. Chart shows each buy entry bar with a green arrow and […]
E-mini Bulls Want Strong Buy Signal Bar Closing on High
Trading Update: Thursday July 9, 2026 S&P E-mini market analysis E-mini daily chart E-mini 5-minute chart and what to expect today Yesterday’s E-mini setups Jed created the SP500 E-mini chart. Here are reasonable stop entry setups from yesterday. Chart shows each buy entry bar with a green arrow and each sell entry bar with a […]
Señales y Patrones Clave de Day Trading – DAX 8 de Julio
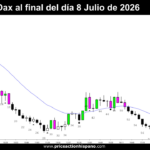
Duración: 14:15 minutos. Descripción ¿Qué patrones y señales clave nos ha dejado hoy el mercado? 📈 En este vídeo analizamos a fondo la sesión del 8 de Julio en el futuro del DAX utilizando un gráfico de barras japonesas de 500 contratos de volumen. Repasamos barra a barra los movimientos del precio bajo la metodología […]
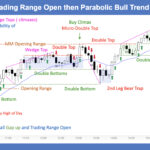
E-mini 7,500 Round Number is Important Magnet
Trading Update: Wednesday July 8, 2026 E-mini end of day video review S&P E-mini market analysis E-mini daily chart E-mini 5-minute chart and what to expect today Yesterday’s E-mini setups Jed created the SP500 E-mini chart. Here are reasonable stop entry setups from yesterday. Chart shows each buy entry bar with a green arrow and […]
Señales y Patrones Clave de Day Trading – DAX 7 de Julio

Duración: 14:52 minutos. Descripción ¿Qué patrones y señales clave nos ha dejado hoy el mercado? 📈 En este vídeo analizamos a fondo la sesión del 7 de Julio en el futuro del DAX utilizando un gráfico de barras japonesas de 500 contratos de volumen. Repasamos barra a barra los movimientos del precio bajo la metodología […]
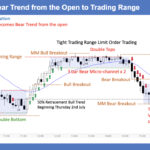
E-mini Bulls Trying for Test of June 15th Lower High
Trading Update: Tuesday July 7, 2026 S&P E-mini market analysis E-mini daily chart E-mini 5-minute chart and what to expect today Yesterday’s E-mini setups Jed created the SP500 E-mini chart. Here are reasonable stop entry setups from yesterday. Chart shows each buy entry bar with a green arrow and each sell entry bar with a […]
La Rutina de Trading de Al Brooks

Duración: 5:26 minutos. Descripción Descubre la rutina de Al Brooks, cómo se elimina por completo el ruido exterior, las noticias y los indicadores complejos para tomar decisiones objetivas basadas únicamente en lo que el gráfico comunica en tiempo real. Lo que aprenderás en este video: 1. Un Setup Minimalista y Libre de Ruido 2. Gestión […]

