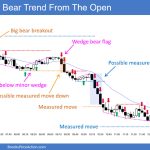
Trading Update: Wednesday April 17, 2024 S&P Emini pre-open market analysis Emini daily chart Emini 5-minute chart and what to expect today Yesterday’s Emini setups Al created the SP500 Emini charts. Here are reasonable stop entry setups from yesterday. I show each buy entry bar with a green arrow and each sell entry bar with […]
Emini Bears Want Test of 5,000
Trading Update: Tuesday April 16, 2024 S&P Emini pre-open market analysis Emini daily chart Emini 5-minute chart and what to expect today Yesterday’s Emini setups Al created the SP500 Emini charts. Here are reasonable stop entry setups from yesterday. I show each buy entry bar with a green arrow and each sell entry bar with […]
Emini Likely to Rally This week.
Trading Update: Monday April 15, 2024 S&P Emini pre-open market analysis Emini daily chart Emini 5-minute chart and what to expect today Friday’s Emini setups Al created the SP500 Emini charts. Here are reasonable stop entry setups from Friday. I show each buy entry bar with a green arrow and each sell entry bar with […]
Bitcoin downside risk after failed High 2
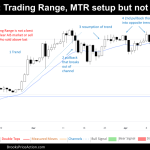
Market Overview: Bitcoin Bitcoin extended sideways action, following a climactic surge, has left both bulls and bears on edge. The weekly chart hints at a potential change in momentum after a bullish run. Meanwhile, the daily chart reveals a tense standoff, with bears gaining an early advantage by creating a Major Trend Reversal setup. Could […]
EURUSD Breakout Below
Market Overview: EURUSD Forex The weekly chart formed a EURUSD breakout below the triangle pattern and the small trading range. The bears need to create follow-through selling next week to increase the odds of a retest of the larger trading range low (October low). The bulls want a reversal from a higher low major trend […]
Crude Oil Pullback?
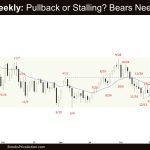
Market Overview: Crude Oil Futures The weekly chart formed a Crude Oil pullback, closing as a bear doji following last week’s breakout above the bull channel. The bears want a failed breakout above the bull channel and a reversal from a wedge pattern. If the market trades lower (pullback), the bulls want the 20-week EMA […]
Emini Consecutive Bear Bar
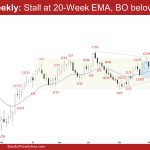
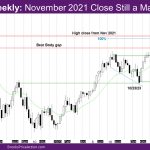
Market Overview: S&P 500 Emini Futures The weekly chart formed an Emini consecutive bear bar, something that has not happened since October 2023. The bulls want to get at least a small retest of the prior trend extreme high (Mar 21), even if it only leads to a lower high. The will bears need to […]
Nifty 50 Breakout Failed
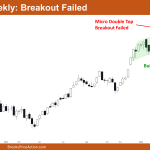
Market Overview: Nifty 50 Futures Nifty 50 Breakout Failed on the weekly chart. This week, the market showed a small bear doji bar with a short tail at the top, still trading within the bull channel. Last week, there was a micro double top formation in the market. Although the bulls managed to break above […]
Nasdaq 100 3 Consecutive Bear Bars Since September 2023
Market Overview: NASDAQ 100 Emini Futures The NASDAQ Emini futures week is a bear doji inside bar. The market continues to be sideways since 2-26, although bears did manage 3 consecutive bear bars since September 2023. On the daily chart, the market oscillated around the exponential moving average (EMA). As was mentioned last week, it […]
DAX 40 Consecutive Bear Bars, After Bull Microchannel
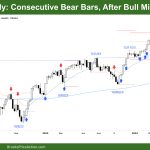
Market Overview: DAX 40 Futures DAX futures pulled back again last week after consecutive bars in an overdone bull spike. We raced past 18000 and now came back to visit. Bears will likely get a second leg sideways to down but it has been quite lonely to sell in this environment for bears so better […]
