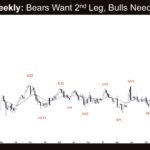
Market Overview: Crude Oil Futures Crude oil bears want a large second leg sideways to down. Bears want the 20-week EMA or the bear trend line to act as resistance. Bulls need consecutive bull bars closing near their highs to demonstrate control. Crude oil futures The Weekly crude oil chart The Daily crude oil chart […]
Monthly Crude Oil Breakout
Market Overview: Crude Oil Futures The market formed a monthly Crude oil breakout below the ii (inside-inside) and triangle patterns in June. Bears want a retest of the 20-month EMA and the breakout point (February 27). Bulls want the 20-month EMA or the March 2 low to act as support. Crude oil futures The Monthly […]
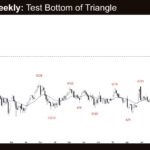
Crude Oil Strong Bear Leg
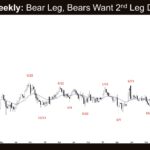
Market Overview: Crude Oil Futures The market formed a Crude oil strong bear leg testing near the March 10 low. The next target for the bears is the June 23 breakout point of the rally. Bulls hope the bottom of the trading range will provide support. Crude oil futures The Weekly crude oil chart The […]
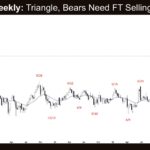
Weekly Crude Oil Bears Want Follow-through Selling
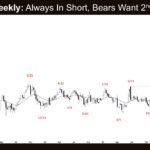
Market Overview: Crude Oil Futures The weekly Crude oil bears want follow-through selling to increase the odds of a sustained move. Bulls want the April 17 or the March 10 lows to provides support. Crude oil futures The Weekly crude oil chart The Daily crude oil chart Market analysis reports archive You can access all […]
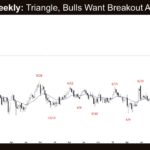
Weekly Crude Oil Bears Want a Breakout
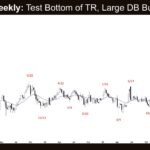
Market Overview: Crude Oil Futures The weekly Crude oil bears want a breakout below the triangle and the 20-week EMA. If the market breaks below the triangle, bulls hope the bottom of the trading range around the March 10 low provides support. Crude oil futures The Weekly crude oil chart The Daily crude oil chart […]
Crude Oil Has Formed a Triangle Pattern
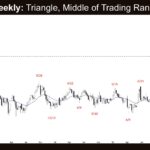
Market Overview: Crude Oil Futures Crude oil has formed a triangle pattern on the weekly chart over the past 13 weeks. Bulls want any pullback to form a higher low relative to the May 6 or April 17 lows. Bears see this week as a pullback and want a second leg sideways to down following […]
Monthly Crude Oil ii Pattern
Market Overview: Crude Oil Futures The market formed a monthly Crude oil ii pattern (inside-inside). The market is in breakout mode. Bears want a breakout below the inside bear bar, while bulls want the breakout to fail and reverse up. Crude oil futures The Monthly crude oil chart The Weekly crude oil chart Market analysis […]
Crude Oil Formed a Lower High
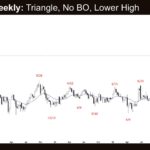
Market Overview: Crude Oil Futures Crude oil formed a lower high after testing the top of the triangle. Bears need to create a strong bear entry bar with sustained follow-through selling to increase the odds of a breakout below the triangle. Bulls want any pullback to form a higher low relative to the May 6 […]
Crude Oil Bulls Want a Breakout Above
Market Overview: Crude Oil Futures Crude oil bulls want a breakout above the triangle to retest the March 9 high and continue the trend. Bears see the current move as a retest of the prior high and want the bear trend line to act as resistance. Crude oil futures The Weekly crude oil chart The […]
Broad Crude Oil Contracting Triangle

Market Overview: Crude Oil Futures The market formed a broad Crude oil contracting triangle with converging trend lines. Bulls want a retest of the March 9 high, followed by a breakout above. Bears need consecutive bear bars closing near their lows and breaking far below the April 17 low to demonstrate control. Crude oil futures […]

