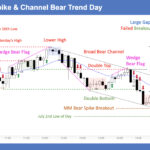
Trading Update: Tuesday July 21, 2026 E-mini end of day video review S&P E-mini market analysis E-mini daily chart E-mini 5-minute chart and what to expect today Yesterday’s E-mini setups Jed created the SP500 E-mini chart. Here are reasonable stop entry setups from yesterday. Chart shows each buy entry bar with a green arrow and […]
If you are not seeing the latest Weekly Report below, your PC/device browser is likely showing you an earlier page copy. Simply refresh your browser. For PCs you can use the F5 key, or Ctrl-F5, several times if needed.
E-mini Continued Sideways Trading on Daily Chart
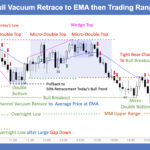
Trading Update: Monday July 20, 2026 S&P E-mini market analysis E-mini daily chart E-mini 5-minute chart and what to expect today Friday’s E-mini setups Jed created the SP500 E-mini chart. Here are reasonable stop entry setups from last Friday. Chart shows each buy entry bar with a green arrow and each sell entry bar with […]
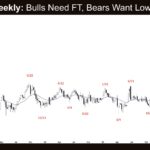
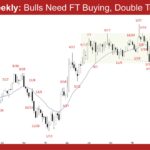
E-mini Bears Want A Double Top Bear Flag
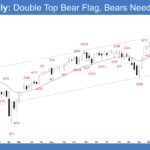
Market Overview: S&P 500 E-mini Futures The S&P 500 E-mini bears want a double top bear flag setup (June 15 and July 10). Bears need consecutive strong bear bars breaking decisively below the 20-week EMA to indicate strength. If the market trades lower, bulls want the June 26 or June 9 lows or the 20-week […]
Weekly Crude Oil Bulls Need Follow-through Bull Bars
Market Overview: Crude Oil Futures The weekly Crude oil bulls need follow-through bull bars to increase the odds of a strong bull leg. If the market trades higher, bears want the May 6 low or the middle of the trading range to act as resistance. Crude oil futures The Weekly crude oil chart The Daily […]
Weekly EURUSD Bulls Need Follow-through Bull Bars
Market Overview: EURUSD Forex The weekly EURUSD bulls need follow-through bull bars closing near their highs to flip the market into Always In Long. Bears view the last three weeks as a pullback forming a double top bear flag (July 2 and July 15). EURUSD Forex market The Weekly EURUSD chart The Daily EURUSD chart […]
Bitcoin Breakout Mode Pattern at the EMA on the Daily Chart

Market Video Report: Bitcoin Duration 18:18 mins. Summary Bitcoin‘s weekly chart is in a trading range after a two-leg move, with bulls triggering a High 2 nested double bottom while bears eye a $50,000 measured move. On the daily chart, price is coiling around the EMA in a tight trading range (Breakout Mode), teasing a […]
Nifty 50 Inside Outside Inside Bar and Breakout Mode Building at the Middle of the Range
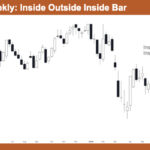
Market Overview: Nifty 50 Futures Nifty 50 Inside Outside Inside Bar and Breakout Mode Building at the Middle of the Range. On the weekly chart, the market has recovered off the April low with a bull leg, but the last three bars form an inside outside inside sequence that has stalled near the middle of […]
Gold The Battle at $4000
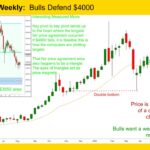
Gold GC-Mini Market Analysis The Gold GC-mini weekly chart is trapped in a trading range near the $4000 level, showing persistent breakout pressure but a lack of follow-through. Bulls are attempting to form a double bottom to secure higher lows, while bears printed decisive consecutive red barswanting to continue prices downward. Bulls want $4000 to […]
Nasdaq 100 First Touch of Ema Since Early April
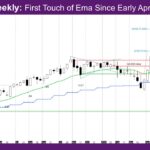
Market Overview: NASDAQ 100 E-mini Futures The NASDAQ E-mini futures week is a bear trend bar with low at EMA – exponential moving average. This is the first touch of EMA since early April. The daily chart has broken below the triangle from last month at the daily EMA, but at support in the weekly […]
E-mini Bears Failing To Get Downside Breakout
Trading Update: Friday July 17, 2026 E-mini end of day video review S&P E-mini market analysis E-mini daily chart E-mini 5-minute chart and what to expect today Yesterday’s E-mini setups Jed created the SP500 E-mini chart. Here are reasonable stop entry setups from yesterday. Chart shows each buy entry bar with a green arrow and […]

