
Market Video Report: Bitcoin Duration 29:11 mins. Summary Bitcoin’s monthly and weekly charts suggest a fair value of $90,000. Although the long-term context favors buyers, the short-term momentum remains bearish with failed breakouts. Trading near these lows carries lower probability for shorts. Awaiting strong bullish structures like double bottoms is preferred. Transcript Hello everyone, and […]
If you are not seeing the latest Weekly Report below, your PC/device browser is likely showing you an earlier page copy. Simply refresh your browser. For PCs you can use the F5 key, or Ctrl-F5, several times if needed.
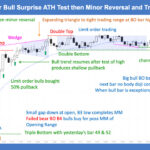
Gold Three Consecutive Monthly Bear bars = Always in Short

Gold GC-Mini Market Analysis The Gold GC-mini monthly chart posted its third consecutive bear bar, throwing the market into always-in-short. However, the past 2 bear bars are weak doji bars. Doji bars are trading range bars which can be clearly viewed on lower time frame charts. We have not seen 3 consecutive monthly bear bars […]
Nasdaq 100 May 2026 Is Strong Follow-Through
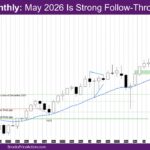
Market Overview: NASDAQ 100 E-mini Futures The NASDAQ E-mini futures May 2026 is strong follow-through to the possibly biggest bull breakout of EMA – exponential moving average. It is also the first time the market has closed above 30000. The week is a good entry bar to the High 1 (H1) buy signal bar of […]
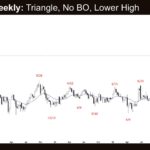
Nifty 50 Triangle Pattern and a Strong Bearish Move
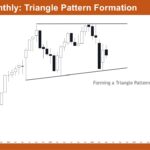
Market Overview: Nifty 50 Futures Nifty 50 Triangle Pattern and a Strong Bearish Move. On the monthly chart, Nifty 50 is forming a multi-month triangle with a flat upper resistance near 26,000 and a rising lower trendline, suggesting that the market is compressing after a strong bull trend. Recent monthly bars show strong bear closes […]
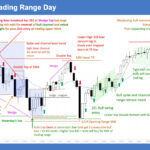
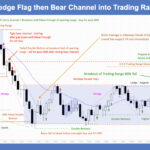
E-mini Sellers at 7,600 Round Number
Trading Update: Friday May 29, 2026 E-mini end of day video review S&P E-mini market analysis E-mini daily chart E-mini 5-minute chart and what to expect today Yesterday’s E-mini setups Jed created the SP500 E-mini chart. Here are reasonable stop entry setups from yesterday. Chart shows each buy entry bar with a green arrow and […]
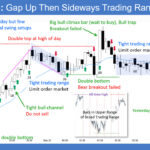
E-mini Profit Taking Likely at 7,600
Trading Update: Thursday May 28, 2026 E-mini end of day video review S&P E-mini market analysis E-mini daily chart E-mini 5-minute chart and what to expect today Yesterday’s E-mini setups Jed created the SP500 E-mini chart. Here are reasonable stop entry setups from yesterday. Chart shows each buy entry bar with a green arrow and […]
E-mini Likely to Test May 19 Recent Higher Low
Trading Update: Wednesday May 27, 2026 E-mini end of day video review S&P E-mini market analysis E-mini daily chart E-mini 5-minute chart and what to expect today Yesterday’s E-mini setups Jed created the SP500 E-mini chart. Here are reasonable stop entry setups from yesterday. Chart shows each buy entry bar with a green arrow and […]
E-mini Testing May All-Time High
Trading Update: Tuesday May 27, 2026 S&P E-mini market analysis E-mini daily chart E-mini 5-minute chart and what to expect today Last Friday’s E-mini setups Richard created the SP500 E-mini chart. Here are reasonable stop entry setups from last Friday (before Monday bank holiday). Chart shows each buy entry bar with a green arrow and […]
E-mini Spike and Bull Channel

Market Overview: S&P 500 E-mini Futures The market formed an E-mini spike and bull channel in the last 8 weeks. Bulls want any pullback to be weak and sideways, lacking follow-through, with overlapping candlesticks and prominent lower tails. Bears need to generate strong bear bars breaking below the minor bull trend line to indicate strength. […]
Crude Oil Formed a Lower High
Market Overview: Crude Oil Futures Crude oil formed a lower high after testing the top of the triangle. Bears need to create a strong bear entry bar with sustained follow-through selling to increase the odds of a breakout below the triangle. Bulls want any pullback to form a higher low relative to the May 6 […]

