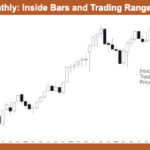
Market Overview: Nifty 50 Futures Nifty 50 Inside Bars and Trading Range Price Action. On the monthly chart, the market remains in a strong multi-year bull trend but has stalled near its all-time high, forming a cluster of inside bars with overlapping bodies. This is a sign that a trading range is developing at the […]
If you are not seeing the latest Weekly Report below, your PC/device browser is likely showing you an earlier page copy. Simply refresh your browser. For PCs you can use the F5 key, or Ctrl-F5, several times if needed.
Gold Bulls Determined to Defend Support
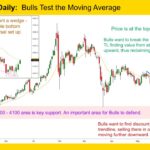
Gold GC-Mini Market Analysis The Gold GC-mini daily bears have put tails beneath the psychological 4000 mark 5 times in the past 8 sessions. While this repeated attempt is significant, take note that bears have been unable to close a body beneath the 4000 mark. Bulls are attempting to draw a line in the sand. […]
Nasdaq 100 Doji Bear Bar with Long Tail Below
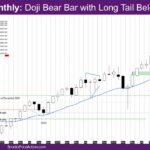
Market Overview: NASDAQ 100 E-mini Futures The NASDAQ E-mini futures June 2026 is doji bear bar with long tail below. The week is a bad bull inside bar – a big tail above. The weekly chart has been sideways this month. The market will likely revisit the weekly exponential moving average (EMA). The quarter ended […]
E-mini Continued Sideways Price Action
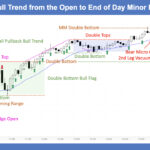
Trading Update: Thursday July 2, 2026 E-mini end of day video review S&P E-mini market analysis E-mini daily chart E-mini 5-minute chart and what to expect today Yesterday’s E-mini setups Jed created the SP500 E-mini chart. Here are reasonable stop entry setups from yesterday. Chart shows each buy entry bar with a green arrow and […]
E-mini Bulls Trying to Reach June 15th High
Trading Update: Wednesday July 1, 2026 S&P E-mini market analysis E-mini daily chart E-mini 5-minute chart and what to expect today Yesterday’s E-mini setups Jed created the SP500 E-mini chart. Here are reasonable stop entry setups from yesterday. Chart shows each buy entry bar with a green arrow and each sell entry bar with a […]
E-mini Bulls Trying For Upside Breakout
Trading Update: Tuesday June 30, 2026 E-mini end of day video review S&P E-mini market analysis E-mini daily chart E-mini 5-minute chart and what to expect today Yesterday’s E-mini setups Jed created the SP500 E-mini chart. Here are reasonable stop entry setups from yesterday. Chart shows each buy entry bar with a green arrow and […]
E-mini Bulls Trying for Test of All-Time High
Trading Update: Monday June 29, 2026 E-mini end of day video review S&P E-mini market analysis E-mini daily chart E-mini 5-minute chart and what to expect today Friday’s E-mini setups Jed created the SP500 E-mini chart. Here are reasonable stop entry setups from last Friday. Chart shows each buy entry bar with a green arrow […]
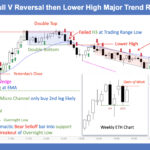
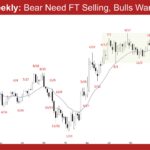
Weekly E-mini Bears Need Strong Follow-through Selling

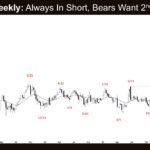
Market Overview: S&P 500 E-mini Futures The weekly E-mini bears need strong follow-through selling breaking decisively below the 20-week EMA to indicate control. Bulls want the pullback to be weak and sideways, lacking follow-through selling, with overlapping candlesticks and prominent lower tails and the 20-week EMA to act as support. S&P500 E-mini futures The Weekly […]
Crude Oil Strong Bear Leg
Market Overview: Crude Oil Futures The market formed a Crude oil strong bear leg testing near the March 10 low. The next target for the bears is the June 23 breakout point of the rally. Bulls hope the bottom of the trading range will provide support. Crude oil futures The Weekly crude oil chart The […]
Weekly EURUSD Bears Want a Breakout
Market Overview: EURUSD Forex The weekly EURUSD bears want a breakout below the trading range followed by a measured move based on the height of the trading range. Bulls want a failed breakout below the trading range, followed by a bull leg to retest the top of the range. EURUSD Forex market The Weekly EURUSD […]

