Market Overview: S&P 500 E-mini Futures
On the weekly chart, E-mini bears need strong follow-through selling. Bears want a two-legged sideways-to-down pullback lasting a few weeks. Bulls see this week as a pullback and want at least a small sideways-to-up leg to retest the all-time high after the pullback, even if it only forms a lower high.
S&P500 E-mini futures
The Weekly S&P 500 E-mini chart
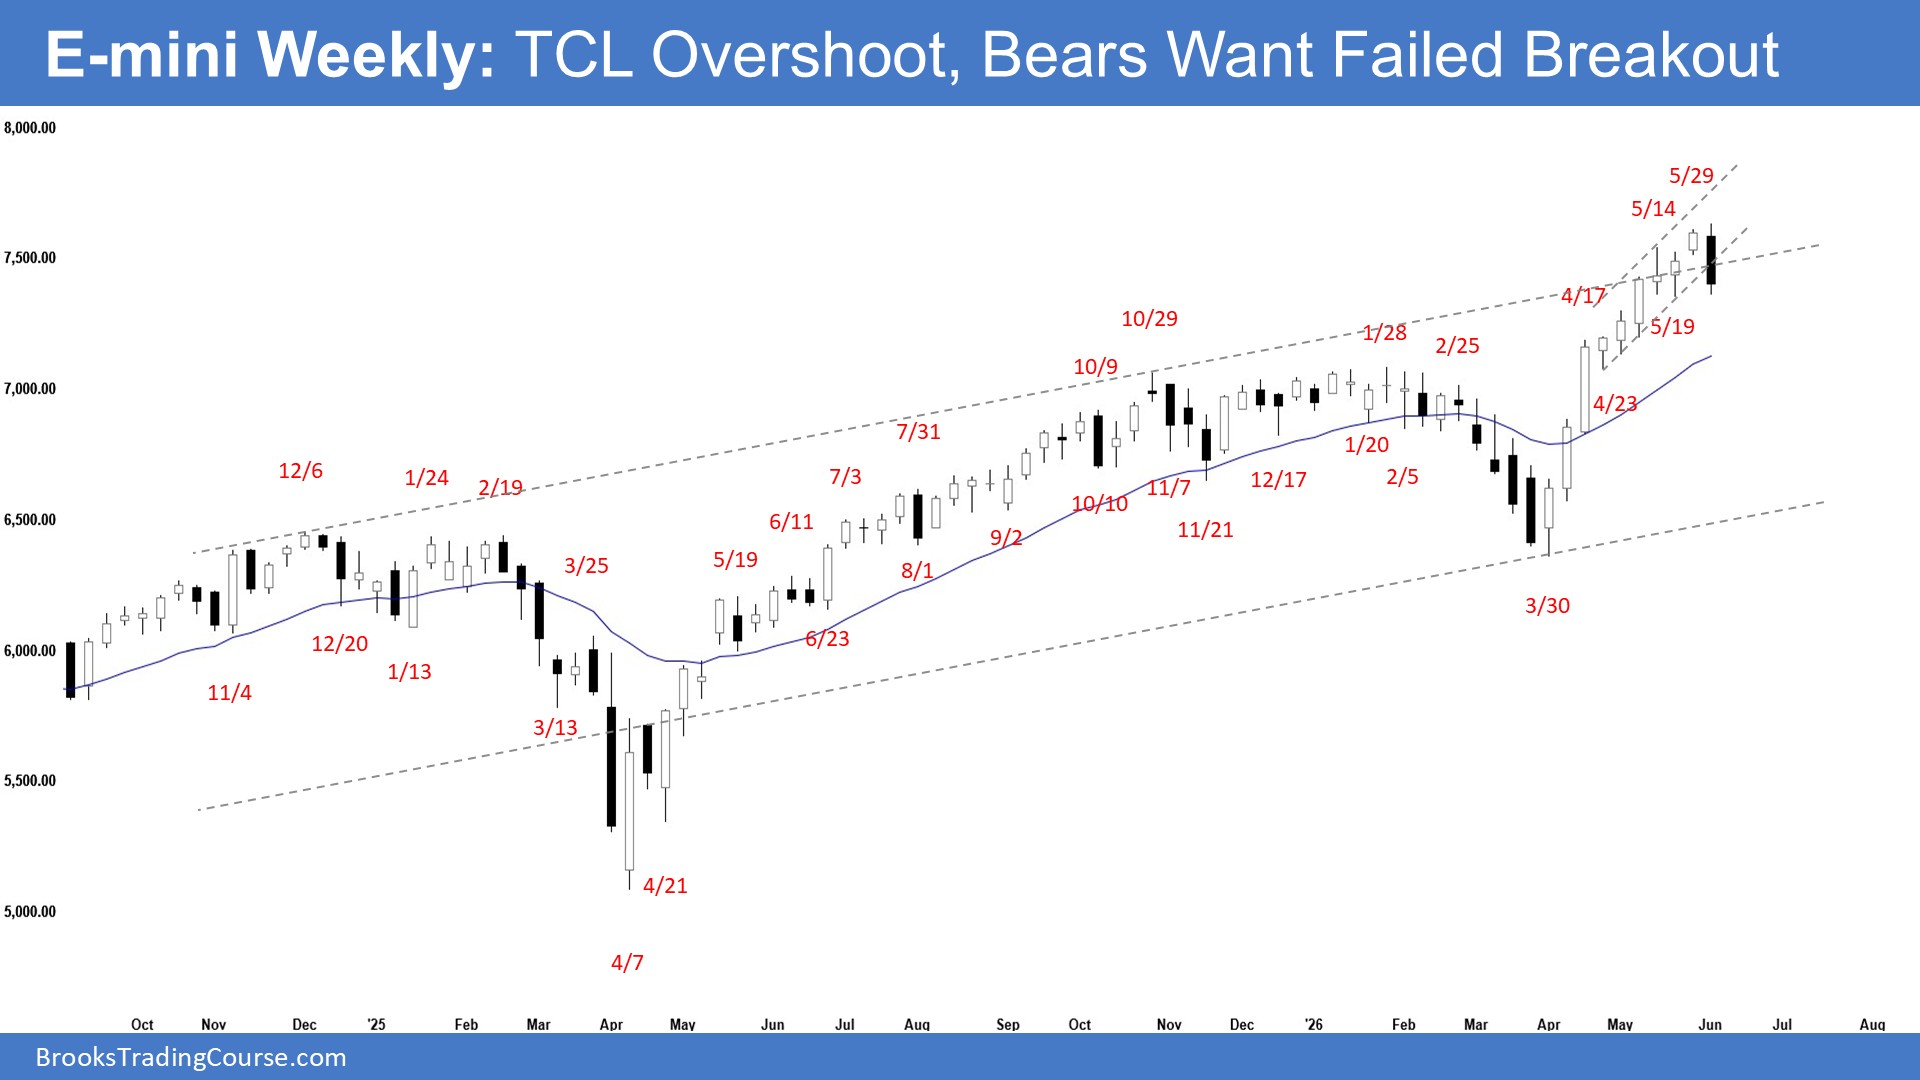
- This week formed an outside bear bar closing near its low.
- Last week, we said traders would watch whether bulls could create more follow-through buying toward the next measured move around 8000 or whether the market would start to form bars with prominent upper tails or bear bars.
- Bulls generated a strong rally in a spike and bull channel from the March 30 low.
- Bulls want a measured move to around 8000, based on the height of the initial spike (from the March 30 low to the April 17 high).
- Bulls see this week as a pullback and want at least a small sideways-to-up leg to retest the all-time high after the pullback, even if it only forms a lower high.
- Bulls hope there are more buyers below the tight bull channel.
- Bulls want the pullback to be weak and sideways, lacking follow-through, with overlapping candlesticks and prominent lower tails.
- If the market trades lower, bulls want the 20-week EMA or the April 23 low (the start of the bull channel) to act as support.
- Bears view the move as a buy climax that is unsustainable.
- Bears want a failed breakout above the trend channel line within a few bars, followed by a test of the bull trend line. This move could be underway.
- Bears want a two-legged sideways-to-down pullback lasting a few weeks.
- Bears generated a strong bear bar breaking below the minor bull trend line this week. They need to create follow-through selling to indicate strength.
- After that, bears want a weak retest of the trend extreme high, forming a lower high major trend reversal or a small double top.
- The market has rallied strongly in a tight bull channel, breaking above the trend channel line.
- While the move is strong, it has lasted a long time without a significant pullback, which is unsustainable and tends to attract profit-taking.
- Breakouts above a trend channel line typically fail within 2 to 5 bars, leading to a pullback into the bull channel or a test of the bull trend line. So far, this appears to be the case.
- Since this week’s candlestick is an outside bear bar closing near its low, it is a sell signal bar for a failed breakout above the trend channel line.
- The market could trade at least a little lower.
- However, this is the first sign of bearish strength since the rally started at the end of March. The first pullback may only be minor.
- Traders will watch whether bears can create a strong bear entry bar testing near the April 23 low area.
- Or whether the market trades slightly lower but finds more buyers below the tight bull channel, followed by a retest of the all-time high within the next few weeks.
- For now, any sideways-to-down pullback would likely be minor, even if it lasts a few weeks.
The Daily S&P 500 E-mini chart
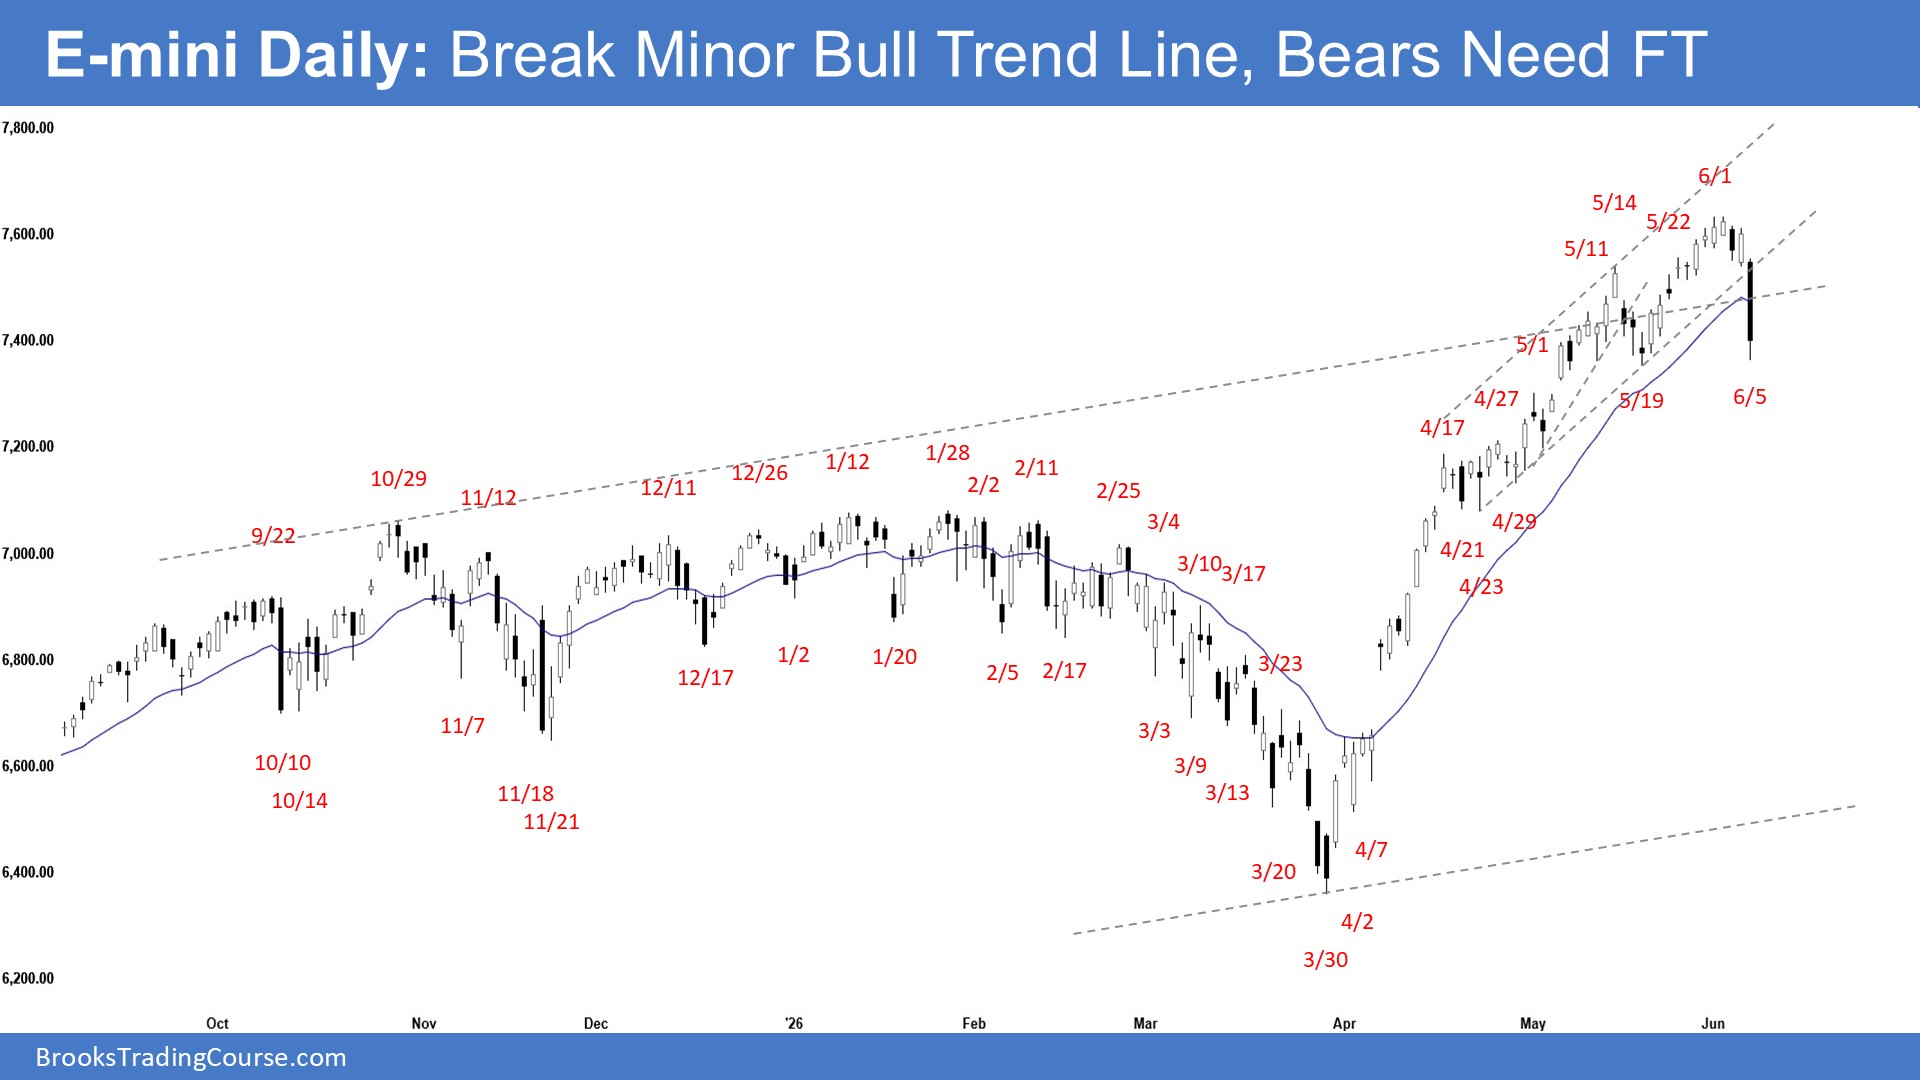
- The market formed a new all-time high early in the week, followed by a pullback that broke below the minor bull trend line and the 20-day EMA on Friday.
- Previously, we said traders would watch whether bulls could create more follow-through buying. If a pullback formed, traders would watch whether it was weak and sideways or strong, with consecutive bear bars closing near their lows.
- Bears view the rally as overextended and climactic.
- Bears want a reversal from a wedge top (May 1, May 14, and Jun 1) and a higher high major trend reversal (the May 19 pullback broke below a minor bull trend line, followed by a higher-high test on June 1).
- Bears want a failed breakout above the trend channel line, followed by a pullback to test the bull trend line.
- At a minimum, bears want a pullback to test the start of the channel around the April 23 low area.
- If the market trades higher within a few weeks, bears want the retest of the trend extreme high to be weak, forming a lower high major trend reversal and a double top.
- Bears need strong follow-through selling to show control.
- Bulls generated a strong spike-and-channel pattern, making new all-time highs.
- Bulls want a measured move to around 8000, based on the height of the initial spike (from the March 30 low to the April 17 high).
- Bulls see this week as a pullback and want the May 19 or April 23 lows to act as support, forming a double bottom bull flag.
- Bulls want any pullback to be weak and sideways, with overlapping candlesticks, bull bars, and prominent lower tails.
- Bulls want a retest of the all-time high after the pullback, even if it only forms a lower high.
- The market rallied in a spike-and-channel bull trend.
- This week, the market broke below the bull channel, the first significant sign of bearish strength since the March 30 low.
- The bull channel phase starting from the April 23 low was relatively tight, which acts as a spike on a higher-time-frame chart.
- Consecutive spikes (climaxes) increase the odds of a minor pullback within a few weeks. The pullback is underway.
- Traders will watch whether bears can create a strong two-legged sideways-to-down pullback toward the April 23 low area.
- Or whether the move remains weak and sideways, with overlapping candlesticks, prominent lower tails and bull bars.
- Traders expect at least a small sideways-to-up leg to retest the trend extreme high after the pullback, whether it forms a lower high or continues the trend.
- For now, the pullback may only be minor.
Trading room
Al Brooks and other presenters talk about the detailed E-mini price action real-time each day in the Brooks Trading Course trading room. We offer a 2 day free trial.
Market analysis reports archive
You can access all weekend reports on the Market Analysis page.


Nice review Andrew, I saw the past 2 days as both being low probability on the daily(All day buying on thurs and all day selling on Fri). Weekly though it seems like the probability did favor the bears. Last Weeks Outside down Bar MM = the BOP (I think the 10/29 and 1/28 DT) + the 20EMA. however 50% PB of last week will test 5/29 weeks’ low(BAD SELL SIGNAL). Me thinks that Bulls would not immediately want to Buy against that Bar, BUT could we get another low probability Day or am I wrong & it is higher probability for Bulls to buy it??? It will be interesting to see how it plays out starting tomorrow… Cheers!
Hey Jason,
Thanks for your input and going through the report..
Yeah, let’s monitor and see how it plays out this week.
Have a great week ahead!
Best Regards,
Andrew