Trading Update: Monday July 13, 2026
E-mini end of day video review

S&P E-mini market analysis
E-mini daily anlaysis
- No written report today due to Brad’s domestic power failure for several hours.
Friday’s E-mini setups
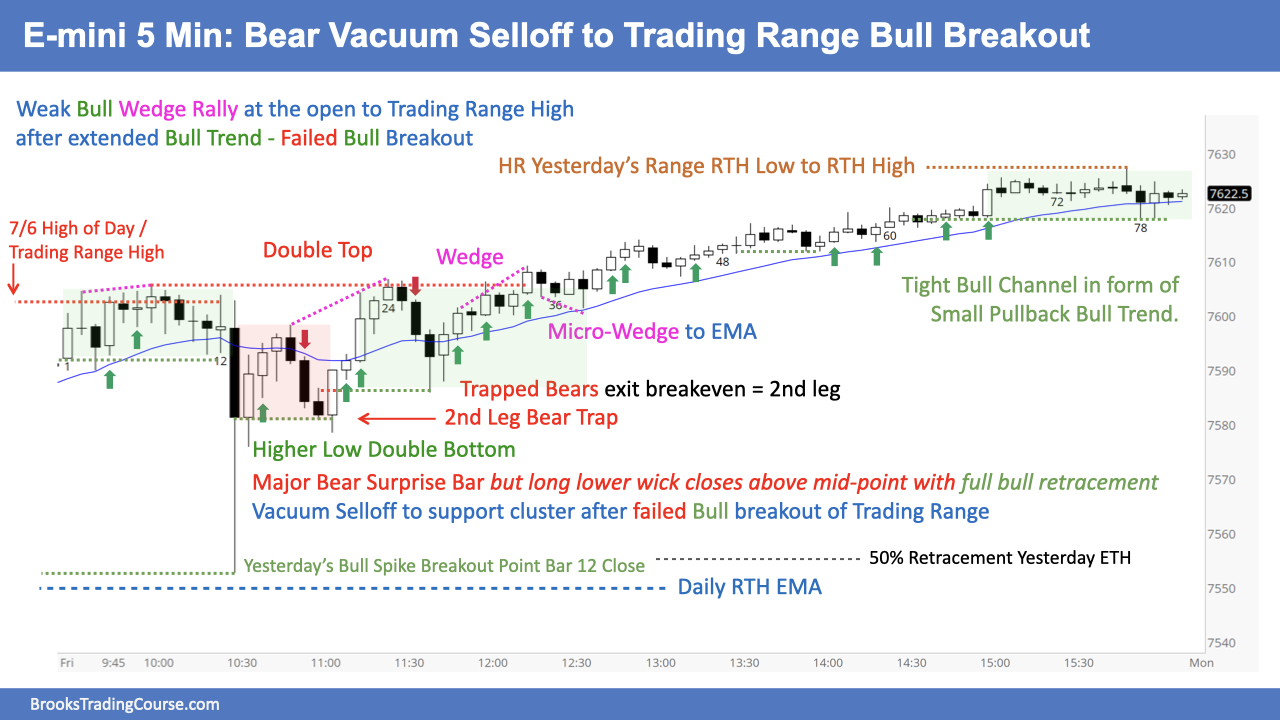
Jed created the SP500 E-mini chart.
Here are reasonable stop entry setups from last Friday. Chart shows each buy entry bar with a green arrow and each sell entry bar with a red arrow. Buyers of the Brooks Trading Course have access to a near 4-year library of detailed explanations of swing trade setups (see Online Course/BTC Daily Setups) linked to the Brooks Encyclopedia of Chart Patterns product.
The goal with these charts is to present an Always In perspective. If a trader was trying to be Always In or nearly Always In a position all day, and he was not currently in the market, these entries would be logical times for him to enter. These therefore are swing entries.
It is important to understand that most swing setups do not lead to swing trades. As soon as traders are disappointed, many exit. Those who exit prefer to get out with a small profit (scalp), but often have to exit with a small loss.
If the risk is too big for your account, you should wait for trades with less risk or trade an alternative market like the Micro E-mini.
Summary of today’s S&P E-mini price action
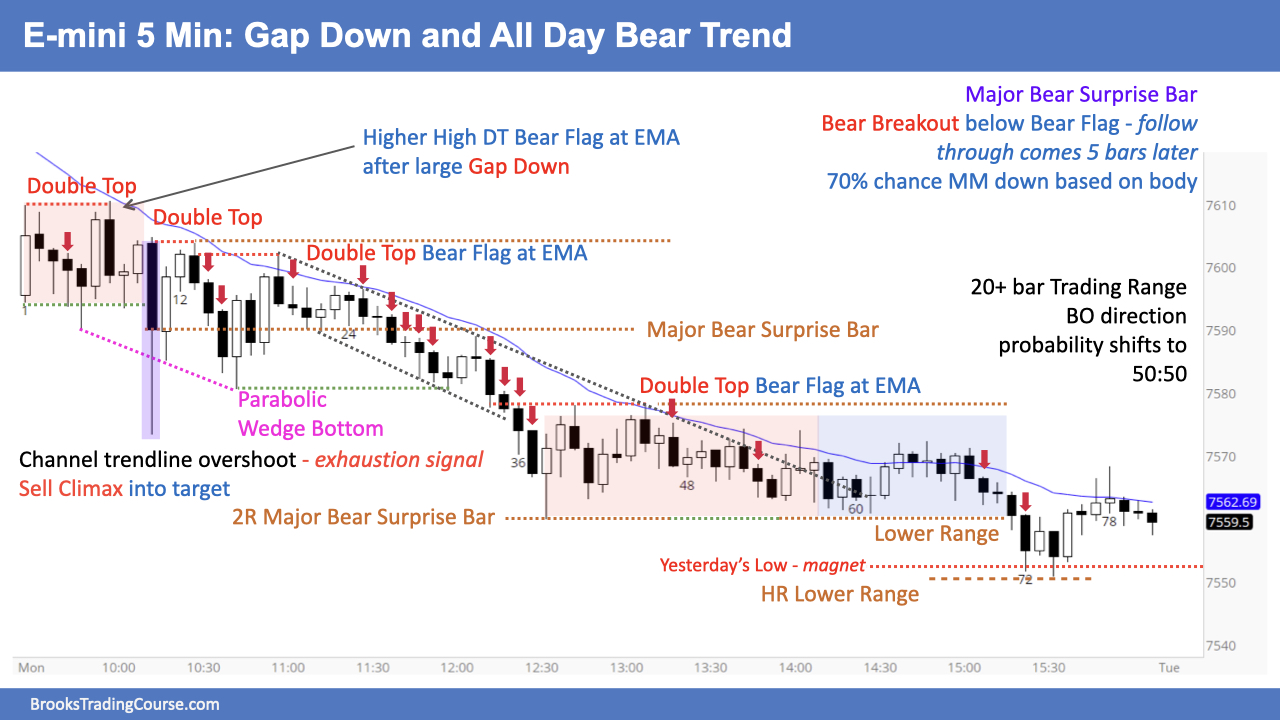
Jed created the SP500 E-mini chart.
See the weekly update for a discussion of the price action on the weekly chart and for what to expect going into next week.
Trading Room
Al Brooks and other presenters talk about the detailed E-mini price action real-time each day in the Brooks Trading Course trading room. We offer a 2 day free trial.
Charts use Pacific Time
When times are mentioned, it is USA Pacific Time. The E-mini day session charts begin at 6:30 am PT and end at 1:15 pm PT which is 15 minutes after the NYSE closes. You can read background information on the market reports on the Market Update page.


Hi there Jed, I have some more questions…
Sorry to be such a pain :/
Te questions are about the “Summary of today’s S&P E-mini price action”.
In the sell below bar 3, is it hoping that bar 1 is a bull trap/Bear flag low and the momentum down would pick up by bulls giving up after 2 bear bars and having the SL hit ? I don’t understand that signal because for me, it would be an area where bulls would buy because bars 2 and 3 are weak.
Why isn’t bar 7 a sell signal short ? I understand that Bears would need to be selling at the low of the TR (Bear Flag) and the RR&probability would require a Break below it, and many bears would prefer to enter on a PB like the average (Buy above bar 6 and buy above bar 8) where bulls would be untrapped (More or less top of bar 9). But it seems like bar 7 is strong enough to have one more leg down…
Is buying above bar 11 a mistake ? Bar 10 broke below the LL DB (bar 1 and 5) and it seems to be failing (wedge). Since bar 10 goes for more than a Leg1=Leg2 MM with the Opening Gap, I would assume that it would be reasonable to enter above bar 11 (Very similar in price action, not in context, to friday’s bar 14). Note that I don’t enter on reversal because I am terrible at it :).
Bar 25 and 49 have signals above them but they did not trigger the Stop order below the prior bar, are they signals for limit or market orders ? They are both bear flag trend line break backtests.
As Dr. Brooks says, Traders have 80% probability of getting out breakeven if they scale-in lower above/below good bars.
Is buying above bar 8, hoping for the market to get to the average with a buy above bar 6. And buying above bar 22, hoping for the market to get to the average with a buy above bar 18, Reasonable ? And does it have 80% Probability of reaching it?
Hope this isn’t too much of a Drag :|.
Thank you very much !!!
Hi Rodrigo — you’re not being a pain, and these are thoughtful questions. However, several of them involve detailed entry logic, order selection, probability, scaling in, and trade management. Those subjects require much more explanation than the daily blog comments are designed to provide.
The “Summary of today’s S&P E-mini price action” is primarily intended as a brief review of the day from an Always In and price-action perspective. The arrows identify potential entry bars or reasonable trader decisions; they are not intended to teach the complete reasoning behind every setup or to specify the exact execution price or order type in every case so it is not best suited to help you on the points you raise.
For questions such as why a particular bar is or is not a reasonable signal, whether a stop, limit, or market order is appropriate, how context affects the quality of a setup, and when scaling in is reasonable, the best resource is the Brooks Trading Course. The relevant sections include signal bars and entry bars, trading ranges, stop and limit order entries, scaling in, and probability versus risk/reward.
We also have a live trading room that works through the market bar by bar and includes time for questions at the end. That is generally a much better format for discussing this type of detailed chart-reading question.
There is also a free end-of-day review video on the website that summarises the day’s price action and provides more context than the written blog summary or the chart markups.
I would suggest using the course and the end-of-day videos to build the underlying framework, and the trading room for detailed questions about individual bars and possible entries. The blog comments can clarify an isolated point, but they are not designed to provide a full lesson on several execution and trade-management concepts at once.
Hope that’s helpful for you. 🙂