The support forum is built with (1) General and FAQ forums for common trading queries received from aspiring and experienced traders, and (2) forums for course video topics. How to Trade Price Action and How to Trade Forex Price Action videos are consolidated into common forums.
Brooks Trading Course social media communities
Brooks Trading Course Learning Resources >>>

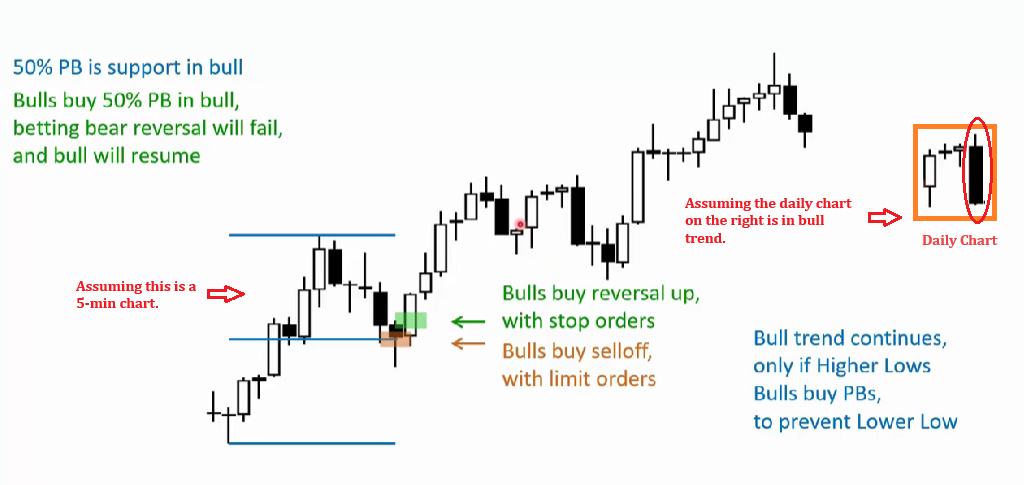
When I watch videos to learn about trading, I often find myself thinking about different scenarios. This leads me to question whether I truly understand the concepts being discussed.
For instance, let's consider a general example using this chart. The video explains that in a bull trend, traders might buy a 50% pullback, expecting the bearish reversal to fail. If I imagine this as a daily chart, I'd consider buying because it's at a strong support level. However, if I look at it as a 5-minute chart, I also need to check if it's not close to the top of the daily resistance from previous days, as previous days highs on daily charts also acts as resistance and lows as support.
So, if the daily chart looks like the one highlighted on the provided image, I wouldn't buy the 50% pullback on the 5 min chart here unless I'm aiming for a quick profit since it may top out at the high of the day from the previous day which is acting as a resistance.
Assuming, even if the daily chart shows a bull trend, if the next day's bull trend price action is close to the previous day's resistance, I need to reconsider how I approach trading the 5-minute chart.
These are the thoughts that cross my mind while watching price action videos. I wonder if further progress in watching upcoming videos will make these concepts clearer. Perhaps there are specific videos on "How to trade" that explain these concepts. Any suggestions or thoughts on this would be greatly appreciated.
@ludopuig @Mr. Carpet
These are the thoughts that cross my mind while watching price action videos
Similarly,
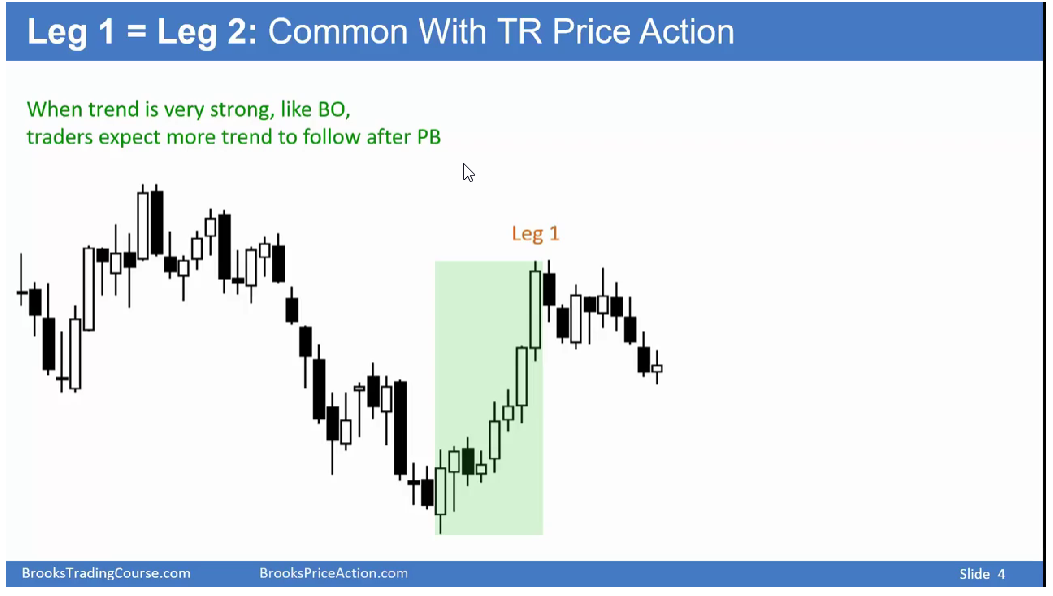
In this scenario, Al points out a bull breakout above the bear channel, marking the formation of leg 1. Examining the notable downward and upward movements on the left, traders interpret this as a trading range in price action. Leg 1 also establishes a lower high. The question arises: Why do traders anticipate a second leg up equal to leg 1? However, there's a potential scenario where a second leg (leg 2) may not occur. Instead, the reversal from leg 1 could test the bottom of leg 1, given the trading range price action and trader might be looking to sell instead?
same chart we have a second leg up here
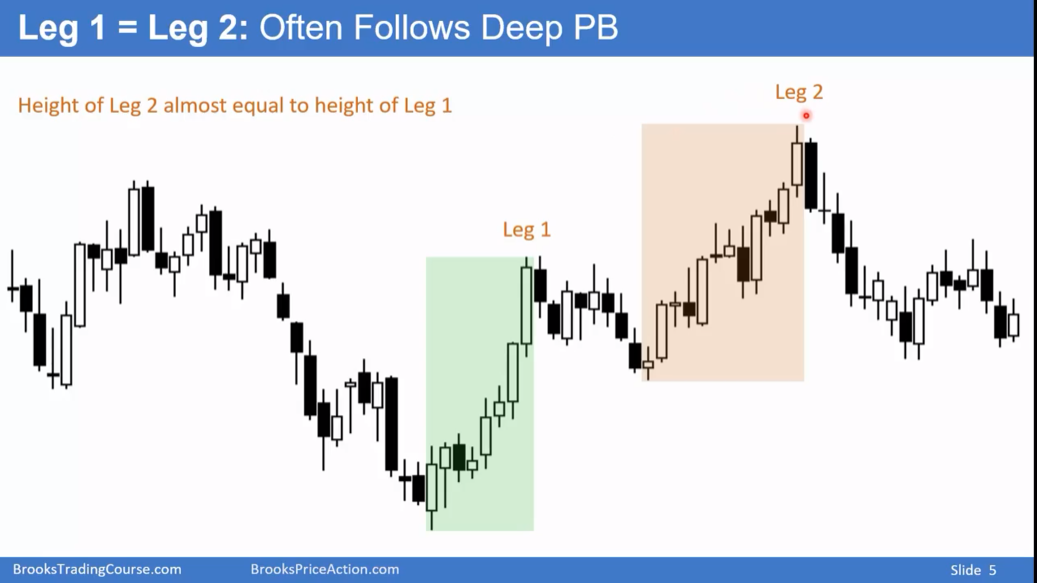

Leg 1 is a 8 bar micro channel expect first reversal attempt to reverse to fail.
Thank you, Mr. Carpet! More questions will follow through, with even more suspicious bars 😉.


