The support forum is built with (1) General and FAQ forums for common trading queries received from aspiring and experienced traders, and (2) forums for course video topics. How to Trade Price Action and How to Trade Forex Price Action videos are consolidated into common forums.
Brooks Trading Course social media communities
Brooks Trading Course Learning Resources >>>

Dr. Brooks tells us that even when a trade goes bad, you can make a profit or breakeven about 80% of the time. I have found this to be true by using his method of doubling the position size when the trade has moved substantially against me and entering again when there's a strong bar in the original direction. Sometimes it's necessary to add on a second time. Of course, this method may not work if you haven't realized that the market has entered a strong trend in the losing direction--then you're sorry that you didn't take a loss earlier.
The method gives you a profit on your add-on contracts when the market returns to the original entry price. Sometimes, the market only returns halfway to that price, and one has to settle for breaking even. Dr. Brooks shows examples of both chart conditions.
If you're going to trade with this idea that, on those occasions when the trade goes bad, you should add a number of contracts equal to the original (sometimes twice), does that mean that you're always entering trades at one-half to one-third your comfortable trade size, e.g., if I'd like to risk 1% of my account on each trade, I need to enter at .5% or .33% to allow for those occasional trades which require adding on?
I have a small account and trade micros. 1% risk is fine. At a smaller percentage risk, there wouldn't be many trades that I could take, even with micros, but increasing my risk when trades go bad hasn't worked well for me either, even with the 80% breakeven/win rate. One bad trade can put me at a substantial loss for the day because, when I've added twice to my position, the risk is so much higher on that bad trade than what I've made on the other trades, e.g., if one risks $100 from each trade entry, the risk from the second entry is $300 ($100+$200), and the risk from the third entry is $600 ($100+$200+$300).
Any thoughts would be appreciated.
Thanks,
Stephen
Thank you so much, CH. This was very helpful. If I could ask you one other question (no favor should ever go unpunished):
I find it relatively easy to identify trades where my profit is about 75%-80% of my risk. These are usually strong bars from an EMA where my entry (for bull bars) is one tick beyond the high, my stop one tick beyond the low, and my target equal to the distance between the open and close. I find that if I take the full length of the bar, I often come out a little short of the target.
I realize that I should be looking for a profit equal to at least two times my risk. I can often identify those using measured moves, Fib extensions and resistance levels. My idea is to trade half my contracts at the high probability first target of the length of the entry bar and the second at the farther target. I'm kind of undecided as to whether I'm best off not moving my stop after hitting the first target and using that first target win as a way of offsetting my loss if the stop is hit or if I should move my stop to breakeven after the first target is hit. Sometimes the latter method saves me a loss and sometimes I lose out on a very good trade.
What concerns me most about either of these methods is that I'm not hitting 2:1. Half of my trade is 2:1 or greater and the other half is .8:1. Taking the $100 per contract example, the 2:1 win is about $280, not $400, and a loss is $200.
I'd love to have your thoughts on all this.

Hi Stephen
One definitive way to determine the profitability and probabilities of your scale-in method/s is to download the 5min ohlc data to Excel, and then crunch the numbers.
It obviously must be precisely done. And it must include plenty of market conditions (strong uptrend, strong downtrend, narrow sideways day, broader sideways days, etc...)
Remember also, it must be based on your entry and exit types (enter above a good bull bar, below a good bear bar, etc....).
You could contract the job out to an Excel expert (if your Excel skills are not at an advanced level).
Regards
Graeme
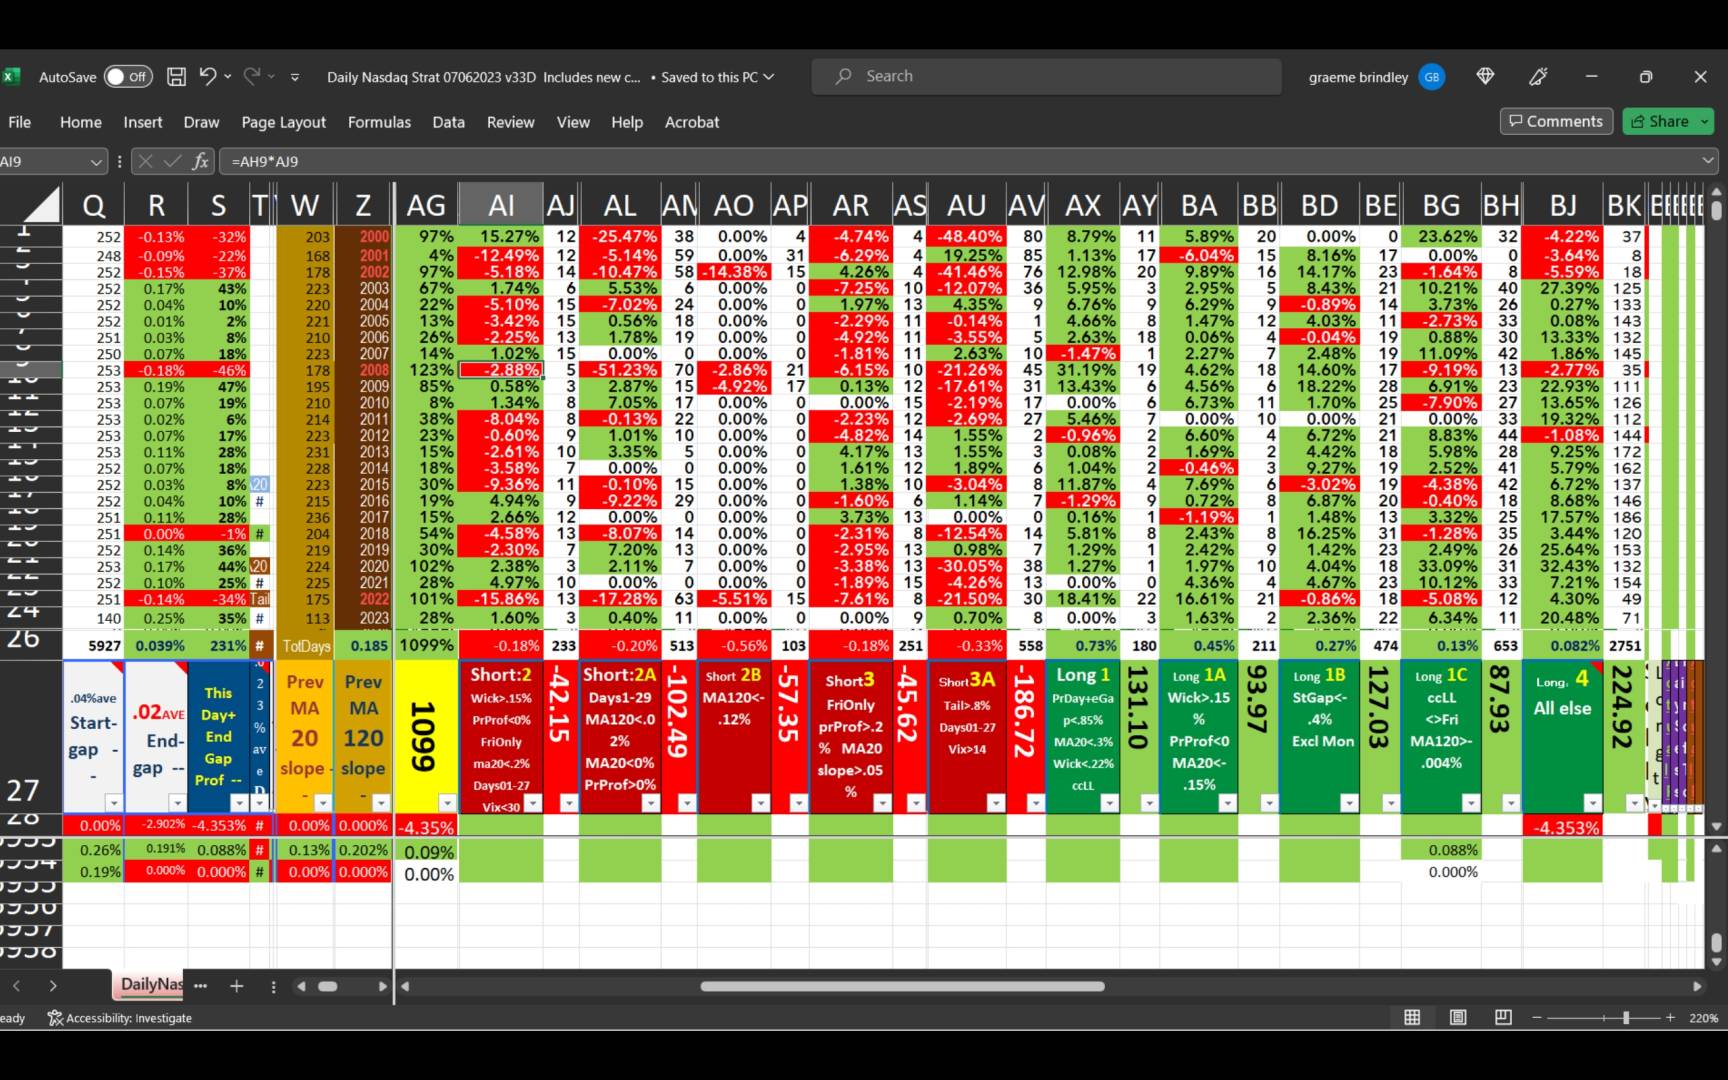
PS: I have performed this exercise on the QQQ daily bars using 23 years of data. To give you an idea of the complexity of this exercise, I attach the Summary results section of my Excel. It wont make much sense, but the 10 larger columns to the right are the 10 sub-strategies of my overall strategy with a brief description of each sub-strategy's trading rules. Each substrategy has differing priority over the other nine substrategies.
But I only partially used the Brooks Trading Course recommeded trading style, and always entering at-market.
Even with my advanced Excel skills it was an exhausting 400-hour exercice involving sleepless nights thinking about potential logical errors and strategy improvements.
It tells me win rates, probabilities, average profits, and outcomes using varying stoploss levels.
It is an always-in strategy, therefore it is always-in long, except approx 25% of bars (days) are in short.