Market Overview: Bitcoin Futures
Bitcoin traded sideways during the week and Traders are wondering if there will be a Bear Continuation of the past week’s bear breakout, or if Bears will fail.
Bitcoin futures
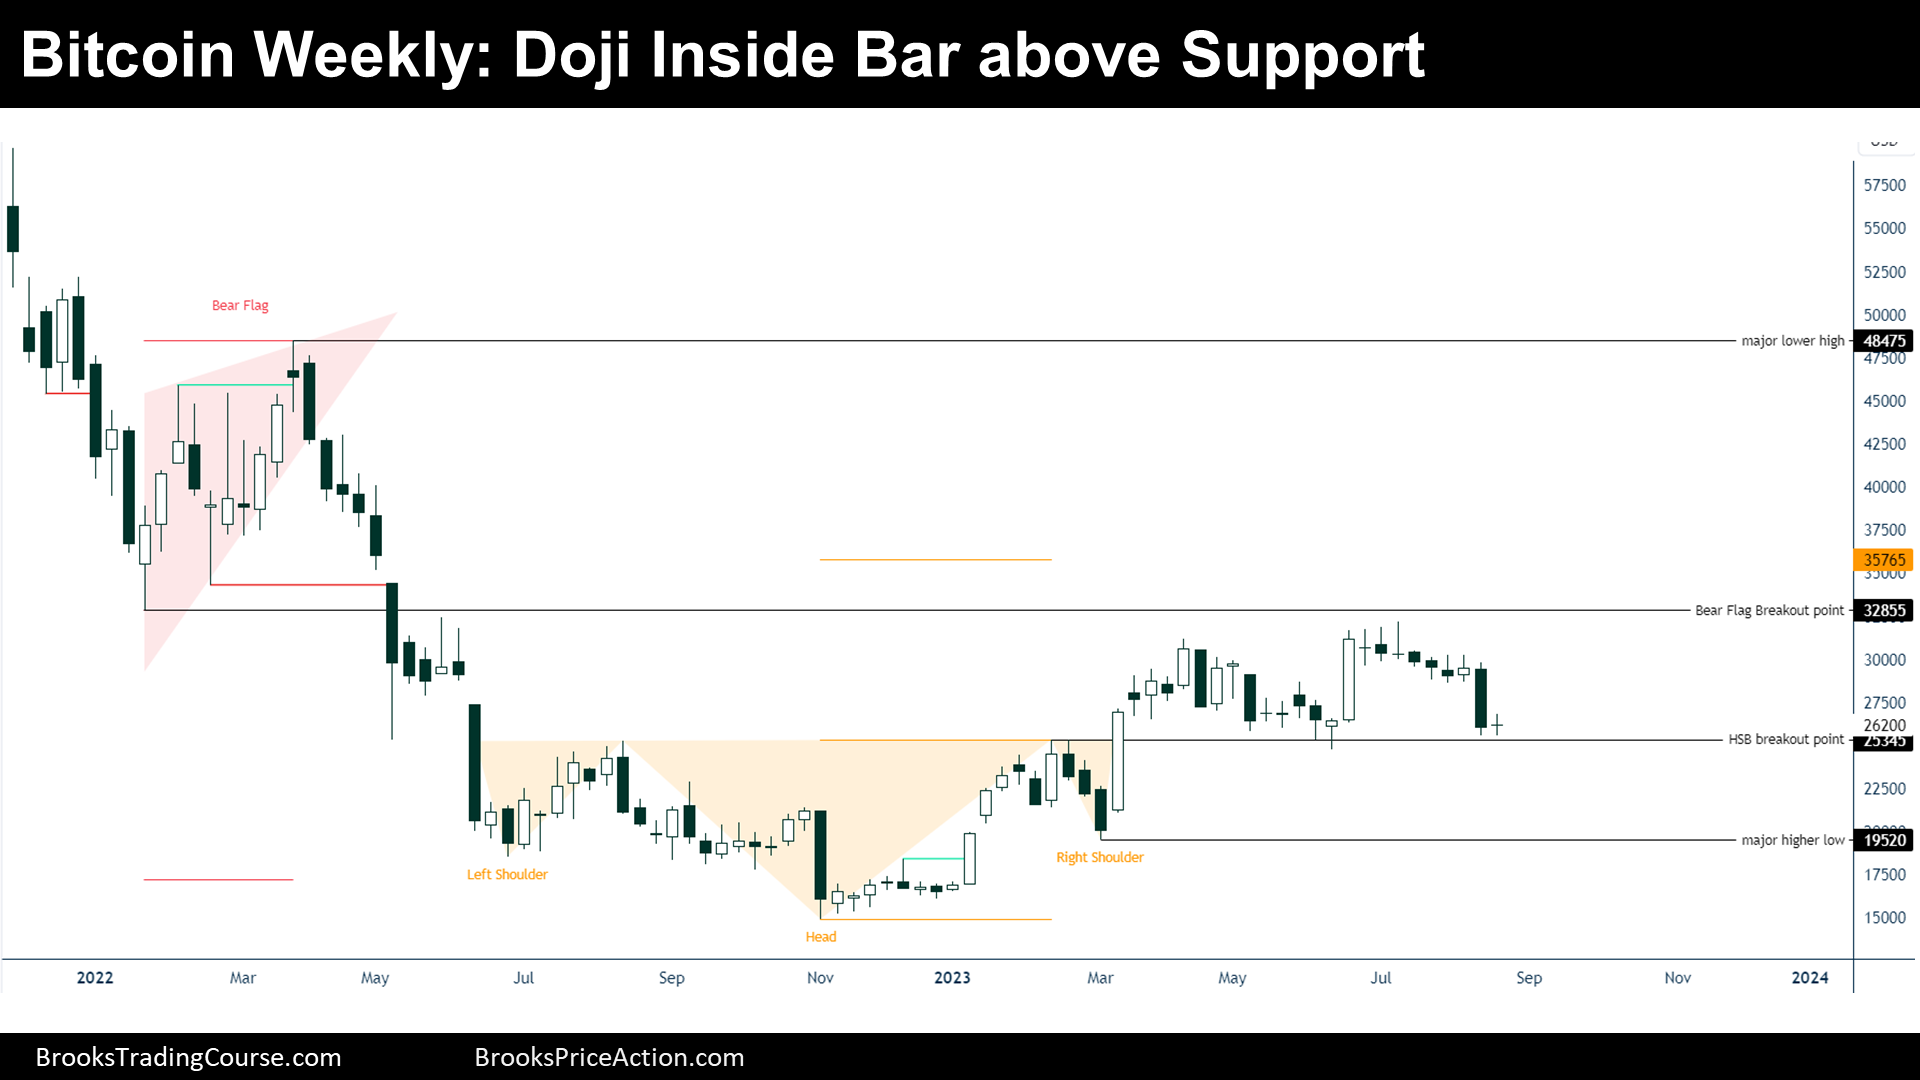
The Weekly chart of Bitcoin futures

Past (Supports & Resistances)
“Every market probes up and down to discover how far is too far, which then becomes support and resistance. Once traders understand this and how to spot logical support and resistance levels, they are in a position to begin trading.” — Al Brooks.
- During 2022, the price created a Bear Flag pattern and then did a strong bear breakout, creating the following resistance levels:
- Major Lower High.
- Bear Flag Breakout Point at $32855.
- Thereafter, the price did a bottoming pattern:
- Head and Shoulders Bottom (HSB).
- Bear Trend Low (2022 low).
- During March 2023, the price did a bull breakout of the HSB:
- HSB Breakout Point.
- HSB Measured Move.
Present (Market Cycle)
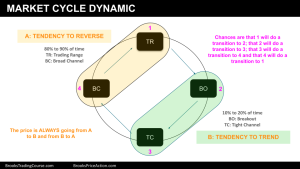
The current market cycle is getting less unclear. There is a bull channel and traders question if the bull channel is a small pullback bull trend (tight channel), or a broad bull channel. This week, the price closed for the 2nd time below the 20-week Exponential Moving Average (EMA), the small pullback bull trend thesis is dying.

During the past report, we have debated which market cycle is dominating the chart, whether a small pullback trend (or tight channel) or a broad channel; However, bulls really need to reverse up quickly and close above the 20-EMA to change what this looks most: a Broad Bull Channel.
A Broad Bull Channel has deep pullbacks that end reversing up until a new high of the channel.
Future (Inertia)

- The current reversal from a Higher High, can lead to test the HSB Breakout point, or even the Major Higher Low, and then reverse up to a new high.
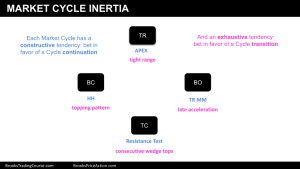
- But the price might form a topping pattern soon:
- A lower high, will form a Head and Shoulders Top or a Triangle.
- A higher high, might constitute a Wedge Top.
- Other Traders already see a top pattern, like a Double Top, but I argue that it is not that important since the double top was created after a negative gap:
- The price did a test at the Head and Shoulders Bottom (HSB) Breakout Point, did not close below the level, and it reversed up to a new high.
- I think that even if the price sells off to the Major Higher Low, bulls and bears will buy there, and the price will trade sideways to up.
In conclusion, I think that there will be another attempt to get to the high at some point.
Trading
- Swing Bulls:
- They might buy at or during a reversal up from:
- HSB Breakout Point.
- Major Higher Low.
- Stop Loss below the 2022 low.
- When the price tends to reverse (Broad Channels and Trading Ranges, placing the stop below a signal bar might not be a good idea because it will not change the market cycle thesis)
- They might buy at or during a reversal up from:
- Swing Bears:
- They will Probably wait to sell below a Lower High (Of a Head and Shoulders Top), betting that this will be a Lower High Major Trend Reversal.
- Others might sell above the 2023 high.
- Stop Loss will be above the 2023 high.
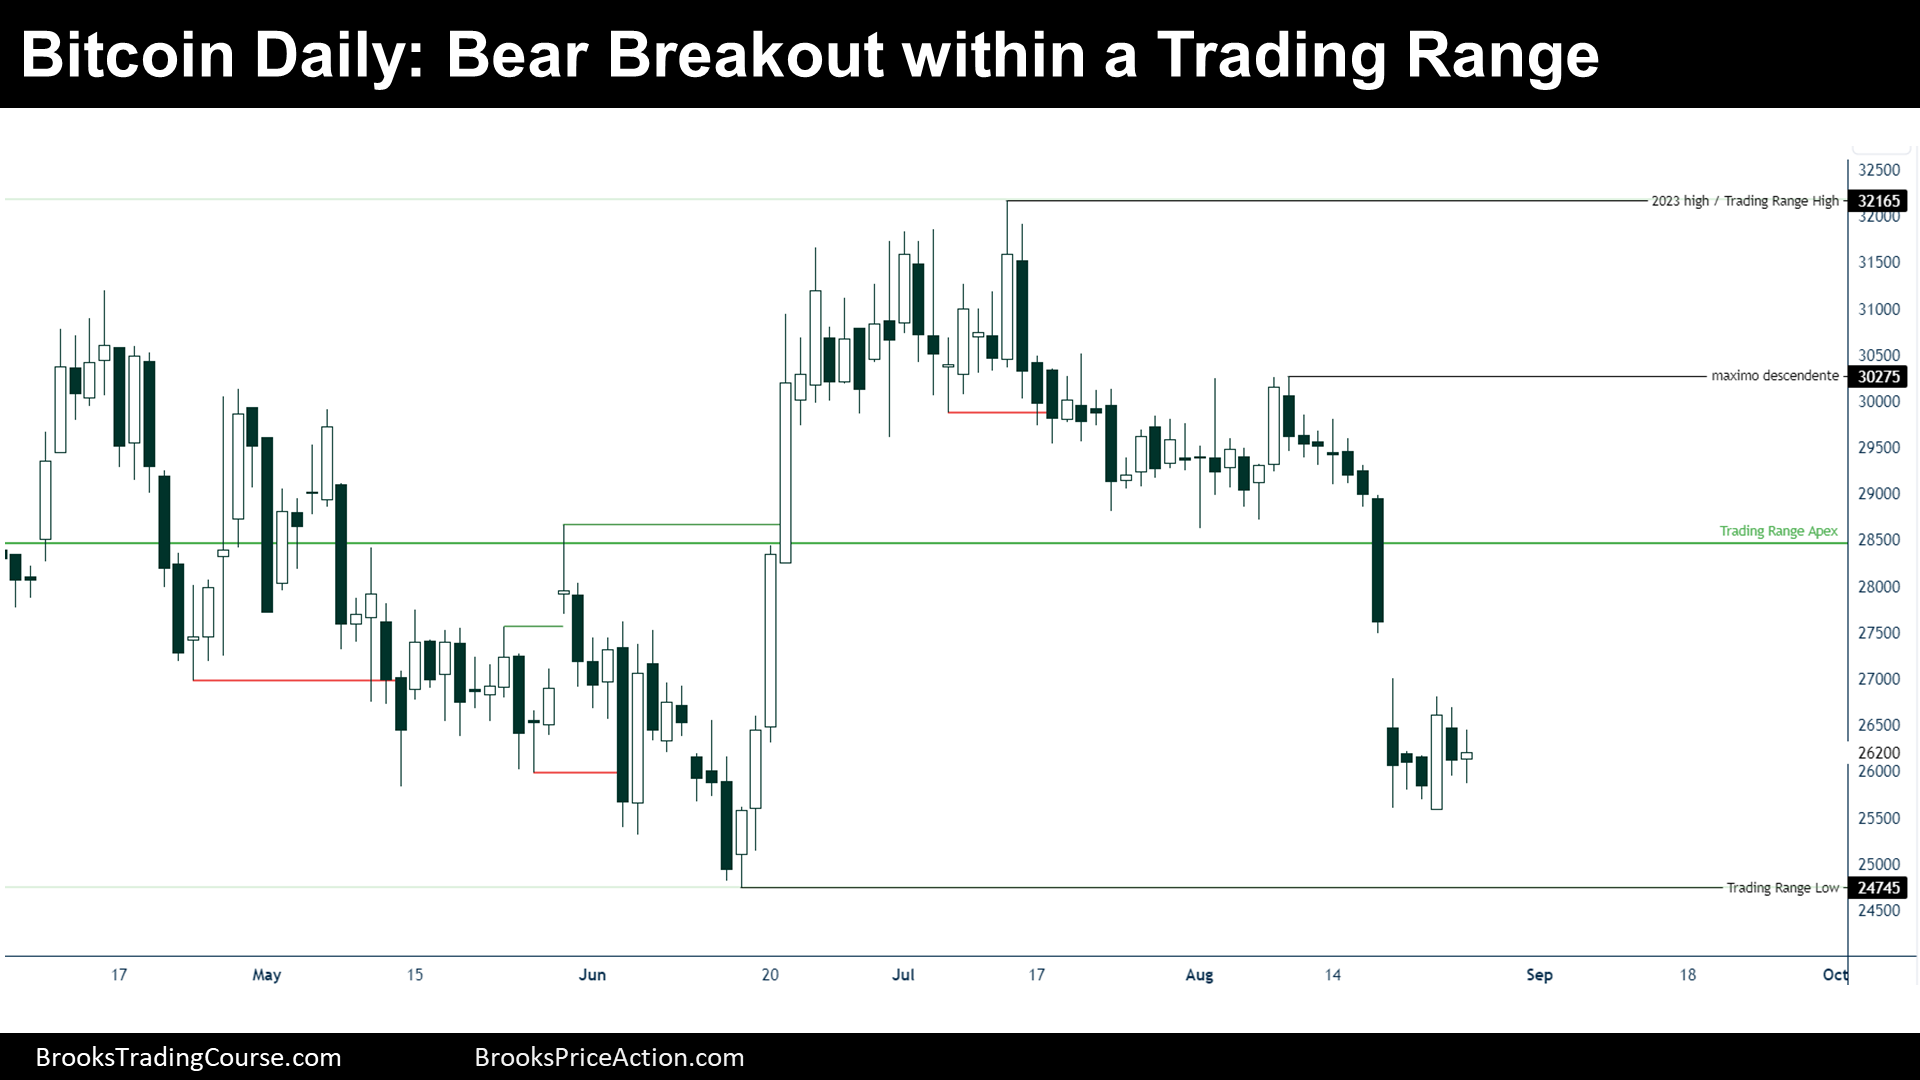
The Daily chart of Bitcoin futures

Past (Supports & Resistances)
- The price did a Bull Breakout by the end of June:
- Low of the Bull Brekaout.
- Then, it went sideways, forming consecutive Tight Trading Ranges, which are Breakout Mode patterns.
- Lately, there was a Bear Breakout of a Breakout Mode pattern:
- Major Lower High at $30275.
- 2023 High.
Present (Market Cycle)
If we look on the left of the chart, we see a Trading Range. Trading Ranges transition into a Trend after comprising (long-lasting tight range) or by a surprising event (context on the left not necessary). Here, we have got a Bear Breakout coming out of a surprising event.
Future (Inertia)
After the Bear Breakout, Traders are considering three possibilities: a Bear continuation or a Bear Failure (a reversal up) or Sideways Trading.
- Bear Continuation:
- There will be a sequence of lower highs and lower lows that will create a Bear Channel, breaking supports.
- Bear Failure:
- Bull bars will follow, and eventually a higher low. At a minimum, there will be a reversal up towards the Major Lower High at $30275.
- This possibility might also be viewed as a continuation of the Trading Range Price Action (Context or Past matters).
- Tight Trading Range:
- The price will trade go sideways into a relative tight range until there is more information.
Trading
I changed my perspective, respecting last week’s Daily chart Trading assumption. I think that Swing Traders can play comfortably this pattern.
- Swing Bulls:
- Bulls want the price to break up this week’s high, and buy above bull bars closing above its high.
- Some might wait a High 2 or 3 before buying.
- Their Stop Loss will be the low of the whole Bear Breakout pattern low.
- If the price fails to trade above this week’s high, they might abandon this idea.
- Or, if the price starts to trade sideways.
- Bulls want the price to break up this week’s high, and buy above bull bars closing above its high.
- Swing Bears:
- Bears want a continuation of the trend, they might sell:
- Below new lows, or a Low 2, Low 3.
- Their Stop Loss is, currently, at the Major Lower High at $30275.
- However, they will trail their quickly if there is another bear leg down, above that bear leg.
- If price fails to reverse down from above this week’s high, they might stop looking to sell.
- Or, if the price starts to trade sideways.
- Bears want a continuation of the trend, they might sell:
Market analysis reports archive
You can access all weekend reports on the Market Analysis page.

