Market Overview: Nifty 50 Futures
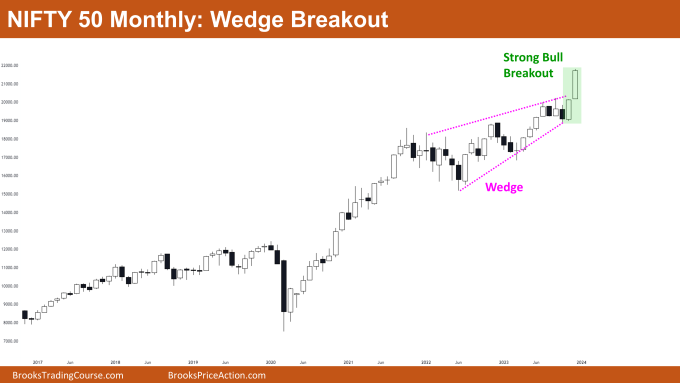
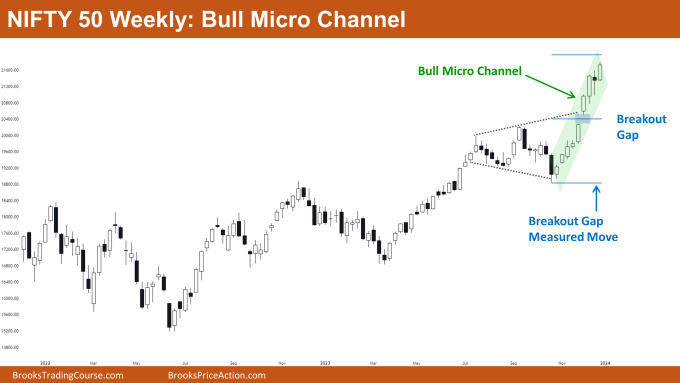
Nifty 50 Wedge Breakout on the monthly chart. The market showed strength this month with a robust bull bar closing near its high, marking a strong bull breakout of the wedge top. The Nifty 50 on the monthly chart continues in a strong bull trend, so bears should refrain from selling unless the market forms consecutive strong bear bars. On the weekly chart, Nifty 50 is within a powerful bull micro channel and has a bull breakout gap, suggesting a potential measured move up.
Nifty 50 futures
The Monthly Nifty 50 chart

- General Discussion
- The market presents two consecutive strong bull bars in a bull trend, advising against bear selling.
- Bulls can consider buying the close of the strong bull bar, given the high likelihood of a second leg up.
- While very strong consecutive bull bars late in a trend may hint at a buy climax, buying remains reasonable. Conservative traders may await a high-1 or high-2 signal bar.
- Deeper into the Price Action
- The failure to produce strong consecutive bear bars indicates bears are struggling to initiate a reversal.
- As the market nears the significant round number 22000, acting like a strong magnet, a successful bull breakout of the wedge top requires a follow-through bar.
- If bears manage a strong bear bar, the chances of a buy climax increase.
- Patterns
- The market, previously in a wedge top pattern, has successfully undergone a strong bull breakout.
- Typically, the odds of a successful bull breakout from a wedge top are 25%, necessitating a robust follow-through for success.
- Failure to achieve a strong follow-through may lead to a measured move down based on the recent bull bars’ height
The Weekly Nifty 50 chart

- General Discussion
- The market, within a bull micro channel with an open breakout gap, advises bears against selling until a strong reversal attempt occurs.
- Bulls, in this bull micro channel, can enter by placing stop orders at the high of bull bars or limit orders at the bars’ lows, given the high chances of a second leg up before a major reversal attempt.
- Long-position holding bulls should maintain their positions until consecutive bear bars form.
- Deeper into Price Action
- The breakout gap suggests a measured move up, calculated by moving a distance equal to the height from the bottom of the leg to the middle of the breakout gap.
- Patterns
- The market’s presence in a bull micro channel indicates that the low of each bar is greater than the low of the previous bar. Note: While there can be bear bars in a bull micro channel, the only rule is that each bar’s low is higher than its predecessor.
Market analysis reports archive
You can access all weekend reports on the Market Analysis page.

