Market Overview: Bitcoin Futures
Bitcoin futures short-term Bitcoin downside risks after bearish follow through during the week. Bears are controlling the market forces while the price is at an inflection point. Traders love inflection points because it gives them opportunities. If bears do not exit their shorts, the price will likely trade at $14000 within the following weeks.
Bitcoin futures
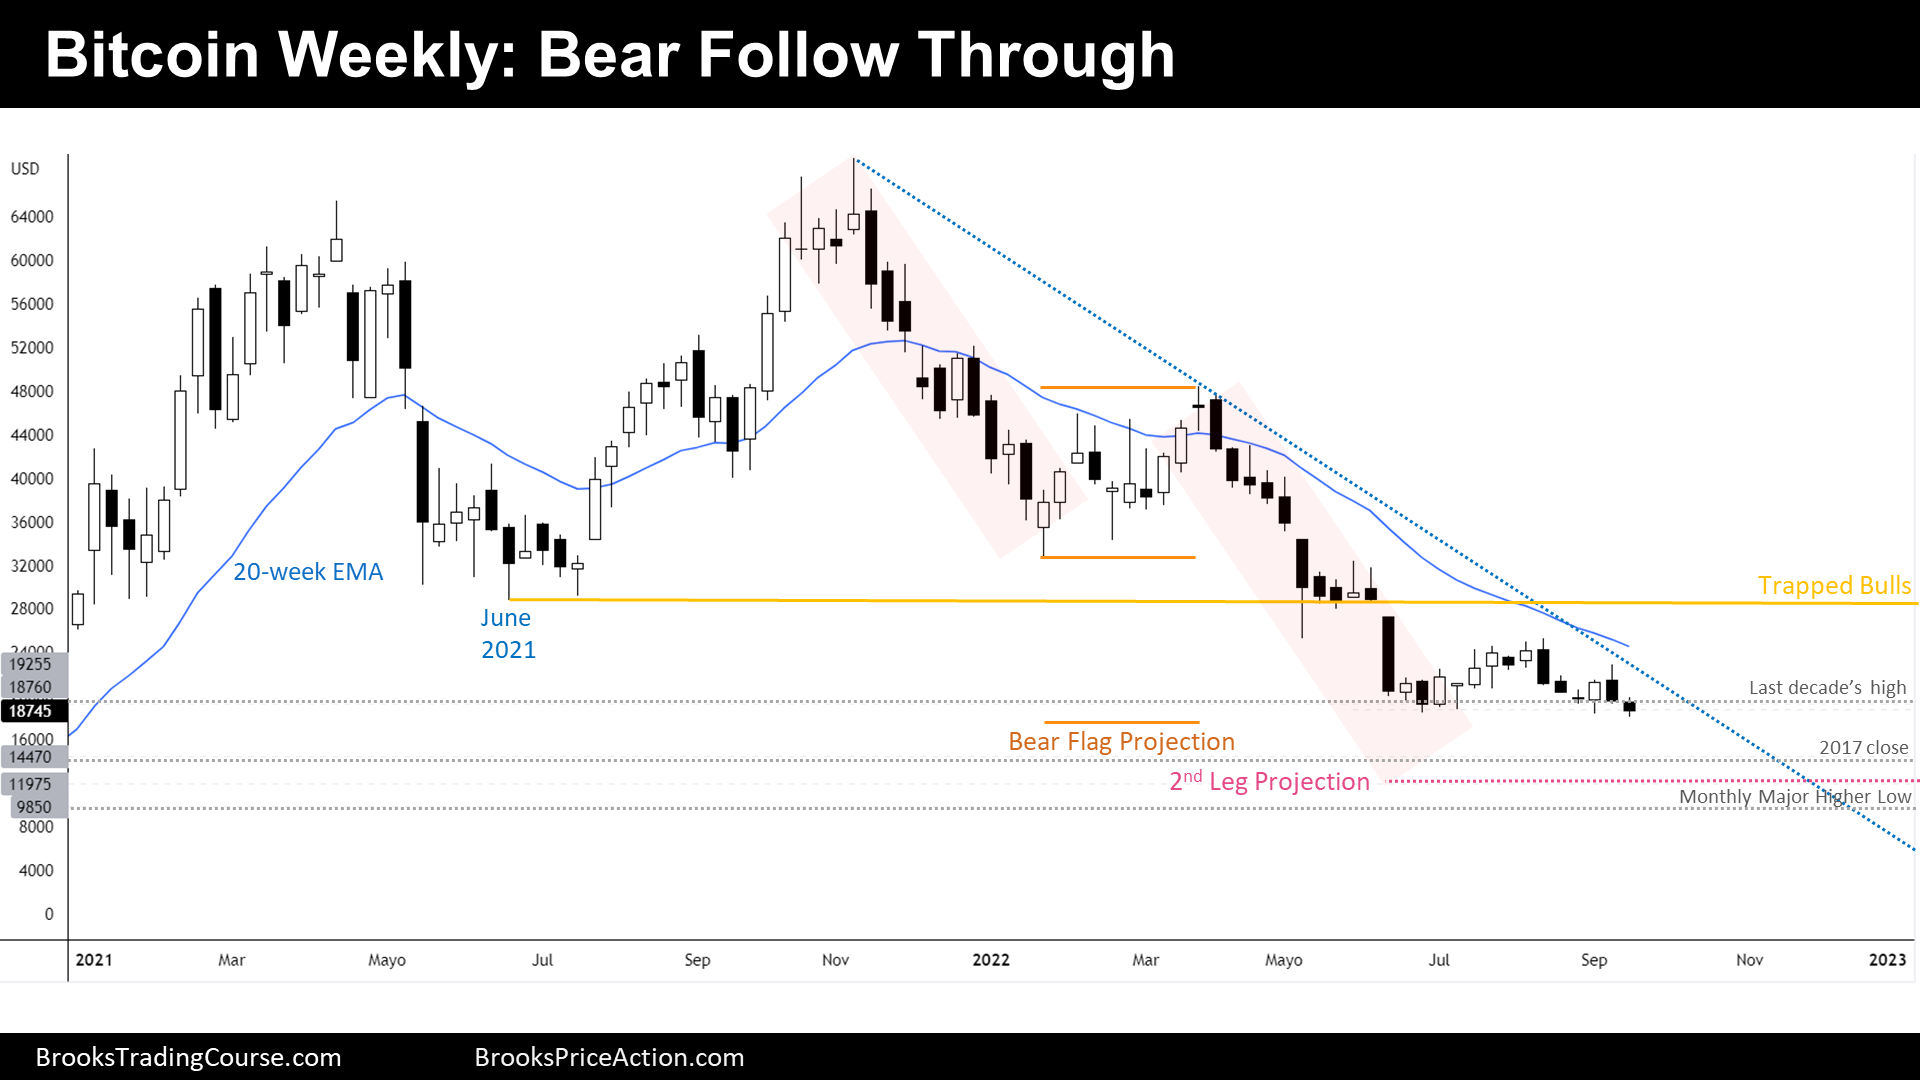
The Weekly chart of Bitcoin futures

- This week’s Bitcoin candlestick was a bear bar with a tail below. A bear bar, following a sell setup, is a good follow-through bar for the bears. Bitcoin downside risks.
- During the prior report we have said that the odds favor bears, and that if the price were to trigger the sell setup, we would probably see new lows of the year. This is what happened.
- The tail below the close of the current weekly bar, may be a sign of bulls setting a floor at around current prices, as we will see in more detail on the daily chart.
- But one thing is an intention, and another thing is a fact. The fact is that nowadays, traders do not see any good reason to buy until bears reach their primary target.
- Moreover, if there is any rally to come, it will probably fail: remember that on the way up there are trapped bulls willing to sell to get out their bad trades.
- After a bear follow-through this week, traders should expect the price to reach the bear flag measured move projection at $17235. There, traders expect a reaction, as many bears will close their trades. If traders do not see reaction there, the price will probably fall to the next targets at around $14000.
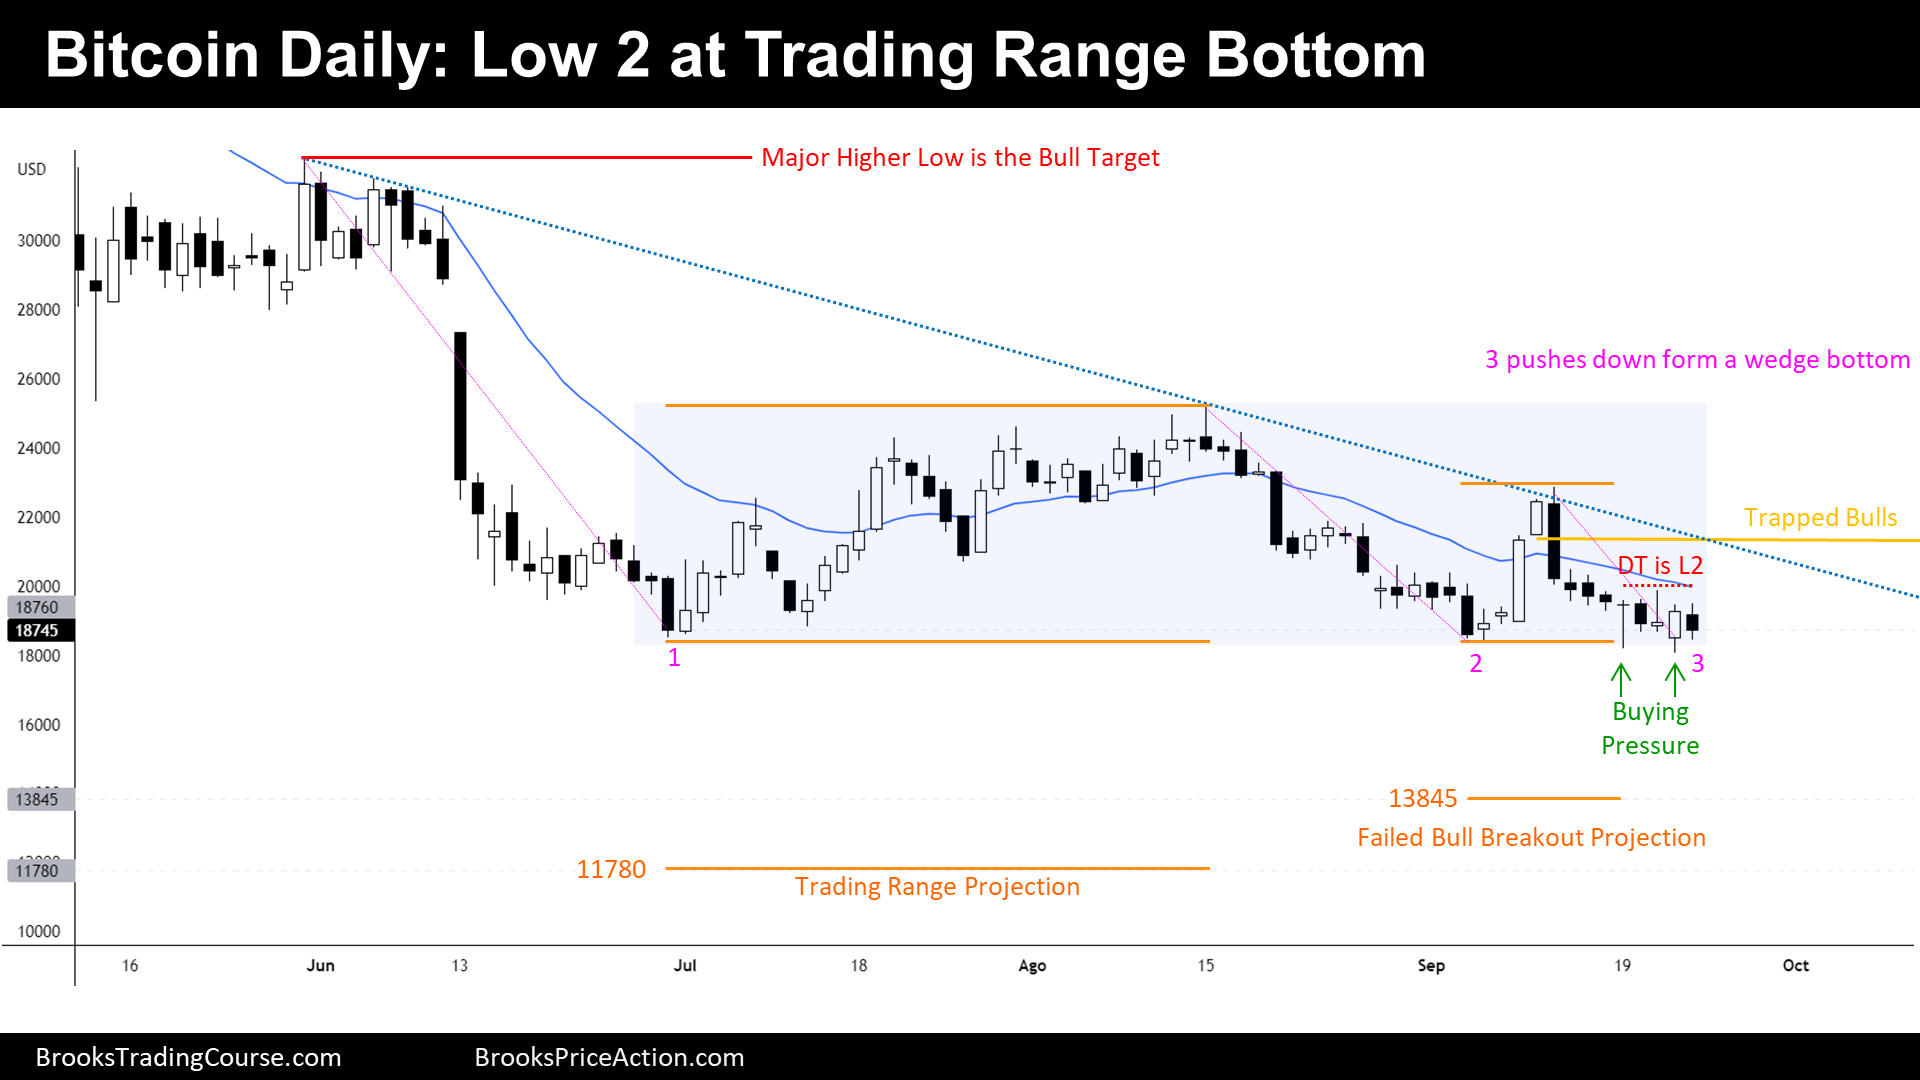
The Daily chart of Bitcoin futures

- During this week, we have seen a new low of the trading range and therefore, a new low this year.
- But actually, the week was sideways. After the new low on Monday, the price reversed up. Tuesday down. Wednesday up and then down. Thursday new low and then it reversed up. What do we notice? That traders are buying every time there is a fresh year low.
- Even if this week was sideways, 7 of the last 9 bars are bear bars. This indicates that the current bear leg is tight, hence, strong. The first reversal up will probably fail.
- This week, there is a bear trend line drawn on the chart. We remark that because there are 3 pushes down from the top of the line. Conceptually, it should be viewed as a wedge bottom. Traders consider a 3rd push an indication of exhaustion.
- The fact that after the 2nd push the price reversed up quickly, practically, without declaring a bear channel, indicates that maybe institutions are defending current prices, setting a floor. Observing and speculating what these kind of signs might tell is fun. But traders, as stated, do not act for fun, but act after facts.
- If traders are buying around this area, it is because we are at a buy zone of a trading range and 80% of attempts to break out of a trading range fail. Furthermore, they might buy because consider that we are at a 2nd leg trap in a trading range (and a 3rd push down of the proposed wedge bottom).
- Why would traders sell here? Because there are trapped bulls below 12th September low. Bulls might sell accepting the loss below a good sell signal bar, hence, provoking a bear breakout. Generally, it is much better to wait until there is the breakout, but bears might consider that the high of the double top Low 2 setup is a good place to put their stop loss; Possibly, they think that a bear trade structure from here might have a positive trader’s equation.
- If bears break down below the trading range, traders should remember that there is an immediate support at $17235 (weekly bear flag measured move projection). However, if the price ignores that target, traders should expect the price go towards the following measured moves projection:
- Failed bull breakout measured move projection.
- Trading range measured move projection.
- If bulls reverse up from here and, specifically, if after trapped bulls exit breakeven the price does not reverse down again, it could mean that a strong leg up to the dominant major lower high might be underway. This scenario is unlikely with current information.
- More likely, the price will trade further down. We are in a tight bear channel and even if the price reverses up, we should expect at least another small leg sideways to down. This means, another test to the lows this year.
Market analysis reports archive
You can access all weekend reports on the Market Analysis page.
Thanks for the update Josep
thanks for the update. setting up a final flag reversal at 13.8k.
I tend to agree but such will happen if PA of major markets will further splash down.
You are welcome! If the price continues down, keep an eye on 17.3k, there might be a strong support there.