Market Overview: Bitcoin Futures
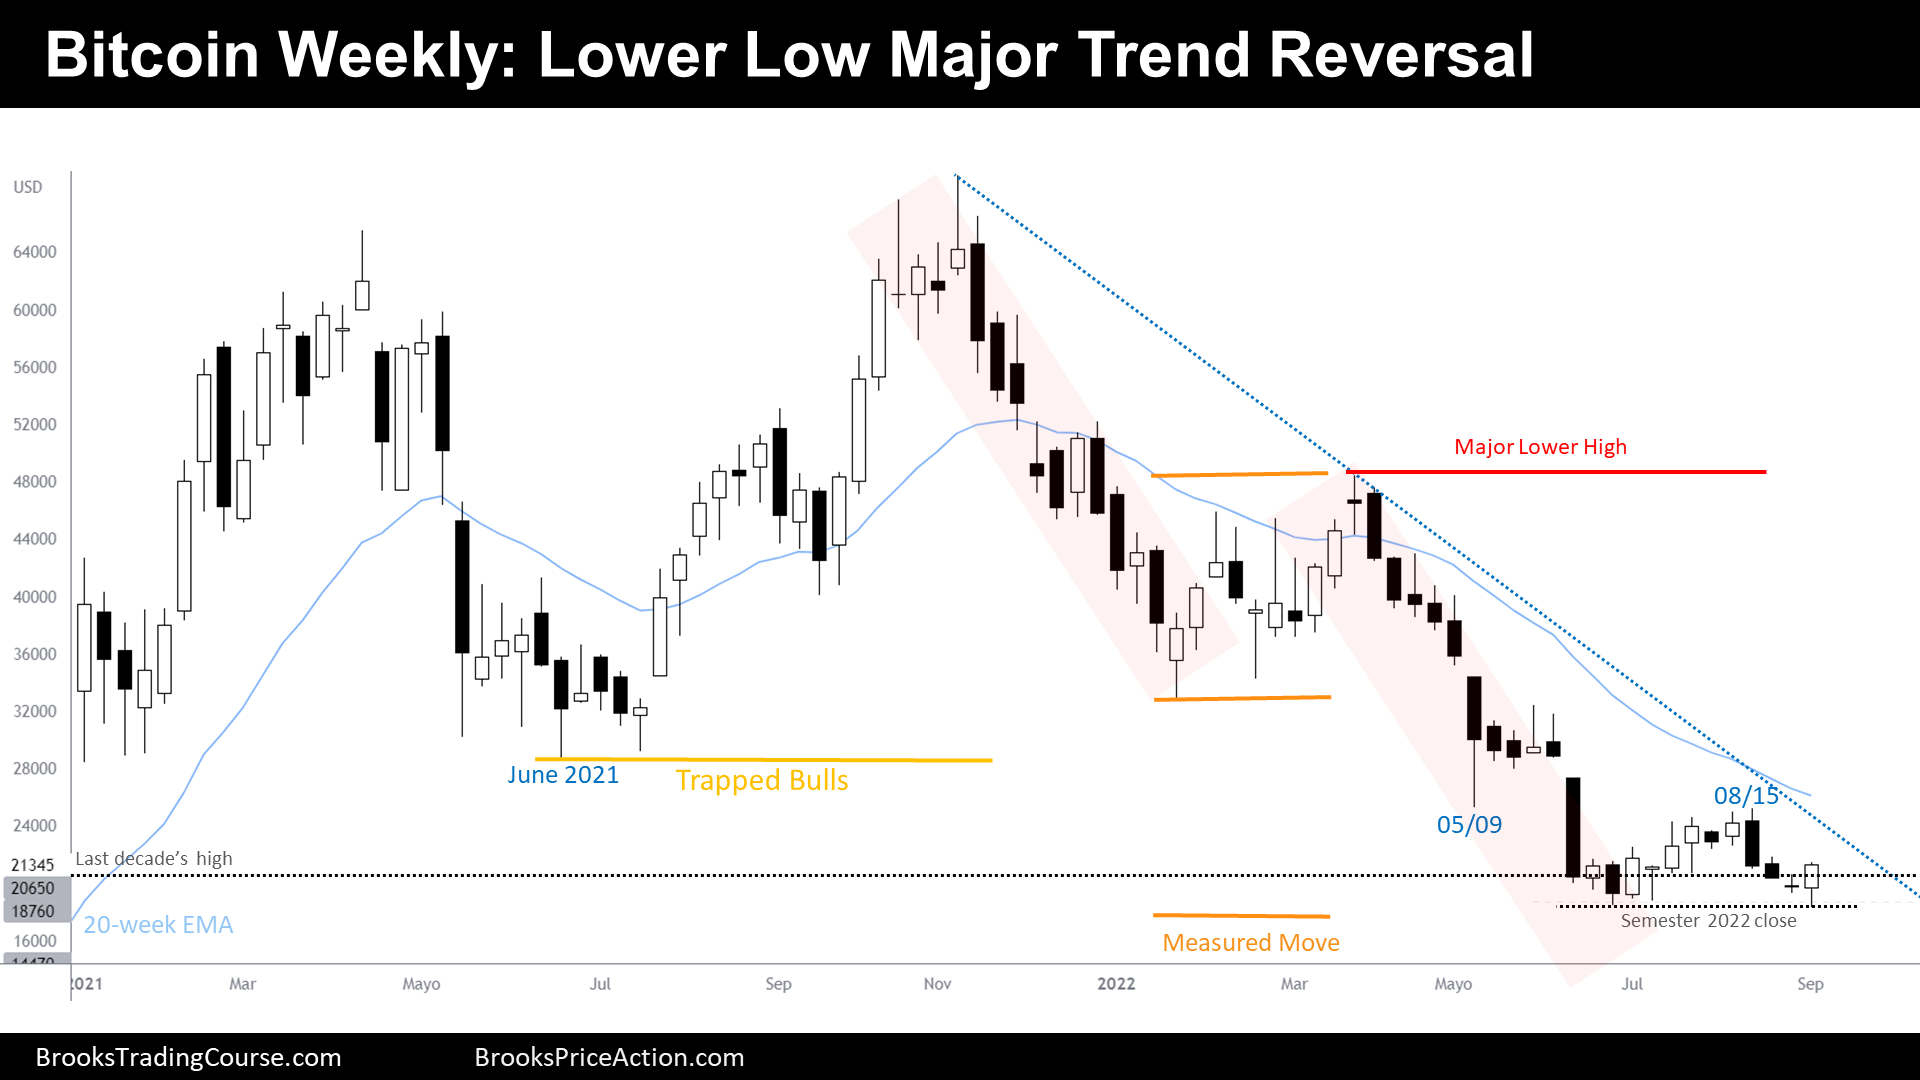
Bitcoin lower low attempting a major trend reversal. During the week, the price settled a new low of the year at $18360 and then reversed up. This behavior indicates that the bears are not strong: they are buying below lower lows; thus, numerous bears are considering closing their trades, which means that some traders will buy back their shorts during the following days.
Bitcoin futures
The Weekly chart of Bitcoin futures

- During the last report, we have said that there was a loss of bearish momentum and therefore, traders were expecting a reversal.
- During the week, the price tested the year low, achieving a new low of the year. Then, it reversed up.
- So far, this week’s candlestick, it is an outside up bull signal bar. It forms a double bottom with June low, but because the low of this week is below June’s low, we can also call this pattern a lower low major trend reversal.
- Traders were watching closely the price behavior around the semester close. After that close, the bear trend stopped by trading up slightly, mostly sideways.
- This week, Bitcoin tested the semester close again and bears failed to consolidate trades below. Two attempts for the bears, two failures.
- Bears want a failed bull reversal next week, but after two failures, that might be an unreasonable thought, wishful thinking.
- Another aspect to consider regarding the “test of year lows”, is that bears achieved a new low of the bear trend, while the price was leaving with an open gap between the 05/09 low and the 08/15 high. This was pretty bearish IF the price was in a bear trend. But reversing up with such conditions, it probably indicates that we are not trending, that we are, as much, in a broad bear channel.
- A broad bear channel is a bear leg in a trading range on a higher time frame chart. The price fails 80% of attempts to break critical price levels when they are tested during trading range price action. All this reasoning might explain why the price is stalling at the prior decade’s high. We have been insisting since June that the bear channel was contained within a trading range.
- Traders are watching to the upside again because if we are sitting in a trading range, what comes after a bear leg is a bull leg. This could be the start of a bull leg.
- Yet, bulls have not an ideal environment to buy. There are trapped bulls above that should add selling pressure. But some will buy anyway because we start to witness many indications suggesting that the price is at a buy zone of a trading range.
- Ideally, bulls would like to buy a higher low major trend reversal some time after trapped bulls exit their longs. Although, ideal scenarios do not happen often.
- Because some bears might exit, and some bulls might buy, we should expect good follow through for the bulls next week, this means, a bull bar without much of a tail above.
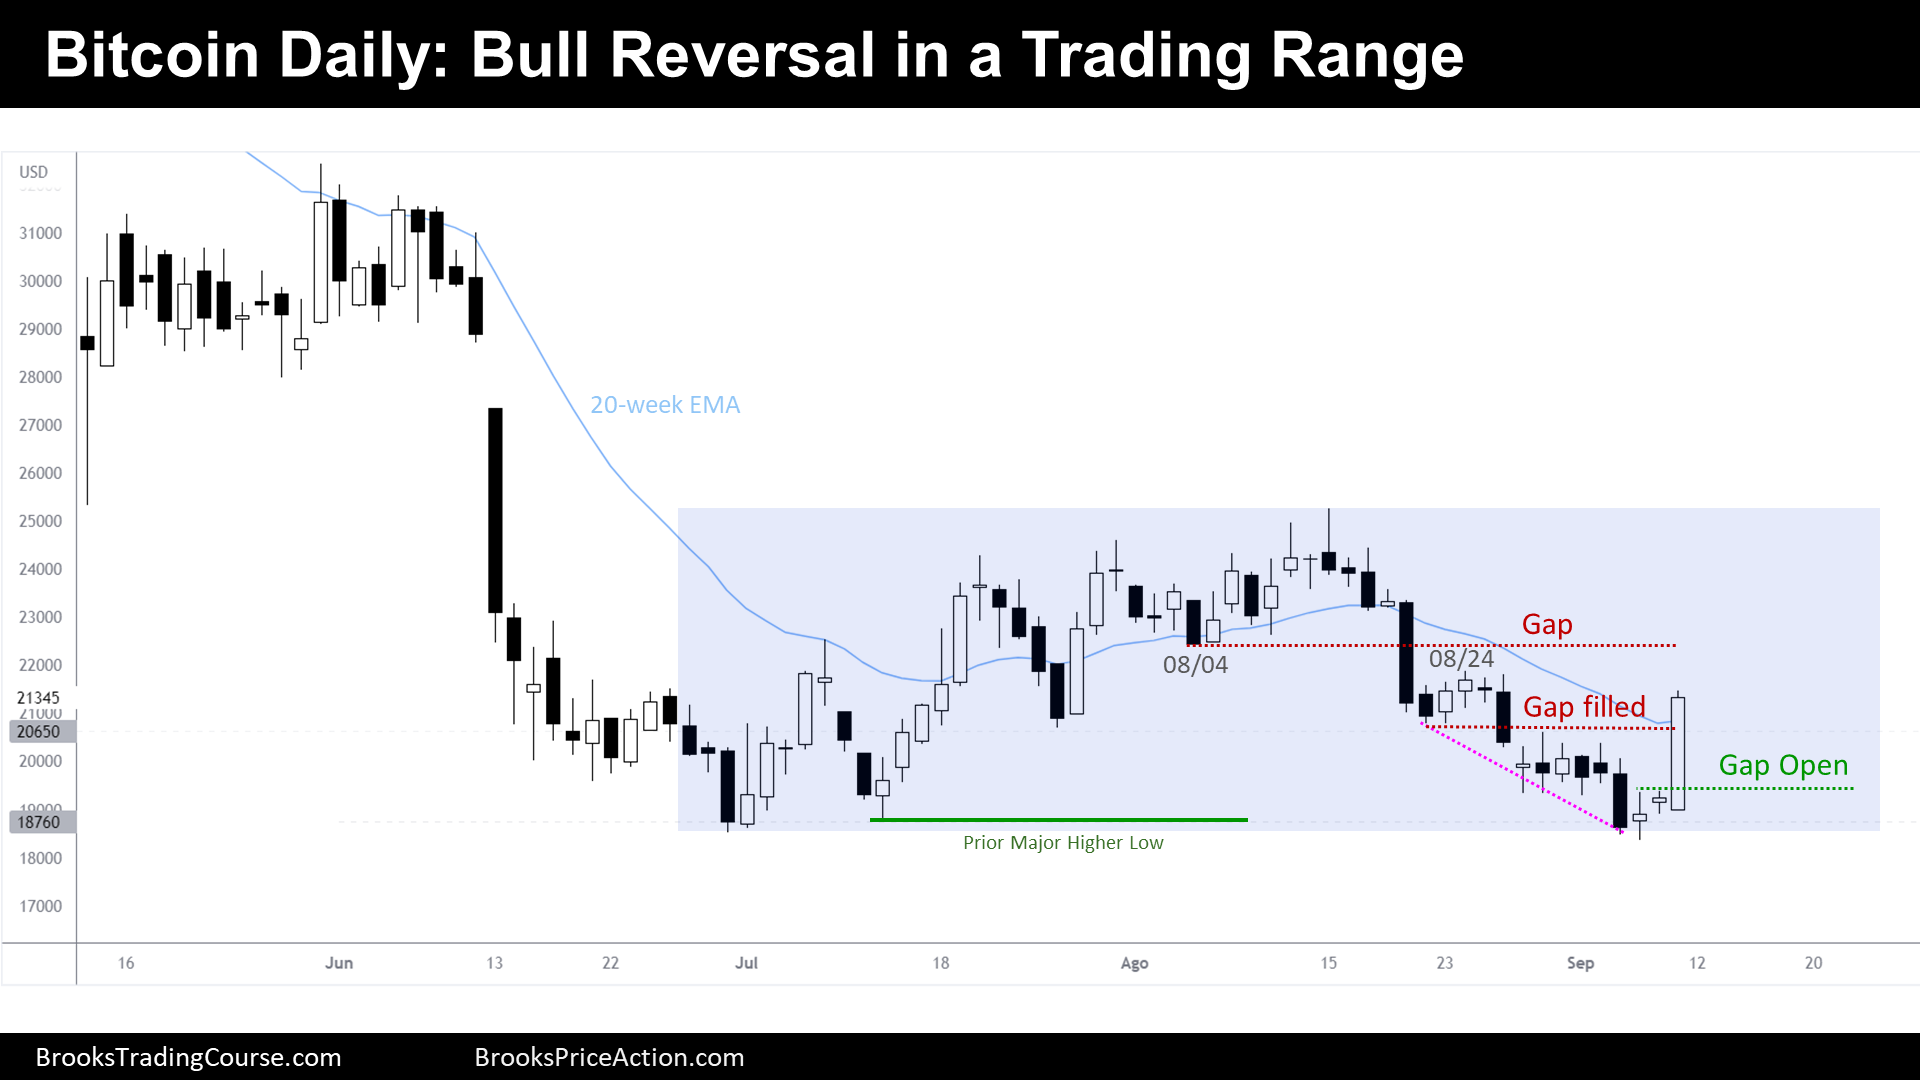
The Daily chart of Bitcoin futures

- During the week, Bitcoin reached the prior major higher low.
- We have said that this was likely to happen because the bears were strong, leaving open gaps and making new lows.
- We also have been saying that bulls were not willing to buy until there was a clear reversal pattern. During the week, a wedge bottom was created.
- Yet, we were within a tight bear channel, expecting the first bull reversal to fail.
- But something surprising happened on Friday: the biggest bull bar on the chart emerged and broke above many prior bars, a major lower high, the 20-day exponential moving average and filled an important gap.
- The bull bar was forceful, it opened at or around the low of the bar and closed near the top.
- The bears hope that this is just a bull leg in a trading range, and that over the next day or days, the bulls will get bad follow through and stall around the 08/24 high forming a double top. That could be our favorite case if during the bear trend the gaps were all closed. Why? Gaps closed during bear trends/legs, means that traders are buying and scaling in lower. When that is the case, and there is, finally, a leg up, scaling in bulls take profits during the reversal up; hence, they sell. Well, this was not the case, the bull surprise bar is probably out of that context and thus, a new context might emerge.
- Many traders won’t sell the Friday’s bull surprise breakout bar. Therefore, this bar might have about a 60% chance of ending up being a measured bar instead of exhausting. If there is or not a good follow through during the next days, it will be crucial to determine the market cycle.
- Next week, some traders will keep trading this chart like a trading range and others will switch and trade it like a breakout. If bulls keep making bull bars without overlap, trading range traders will stop doing their strategy. If there is bad follow through for the bulls or there are overlapping bars, breakout traders will exit.
- More likely than not, we should see higher prices next week and even fill the gap with the 08/04 low.
Market analysis reports archive
You can access all weekend reports on the Market Analysis page.
Thanks again Josep. I enjoy catching up with your Bitcoin analyses every time it’s published.
Many thanks to you for your support! Have a fantastic week ahead!
I really appreciate your weekly contributions, crisp clear and to the point. Perhaps you could do a daily overview here on Brooks Blog 🙂
Hi Alexander, truly appreciate your kind words very much, we are glad that you find the reports useful. Thank you for your proposal regarding a daily update on bitcoin, the BTC team will surely listen to your request.
Wishing you a lovely day ahead!
Josep.