Market Overview: Bitcoin Futures
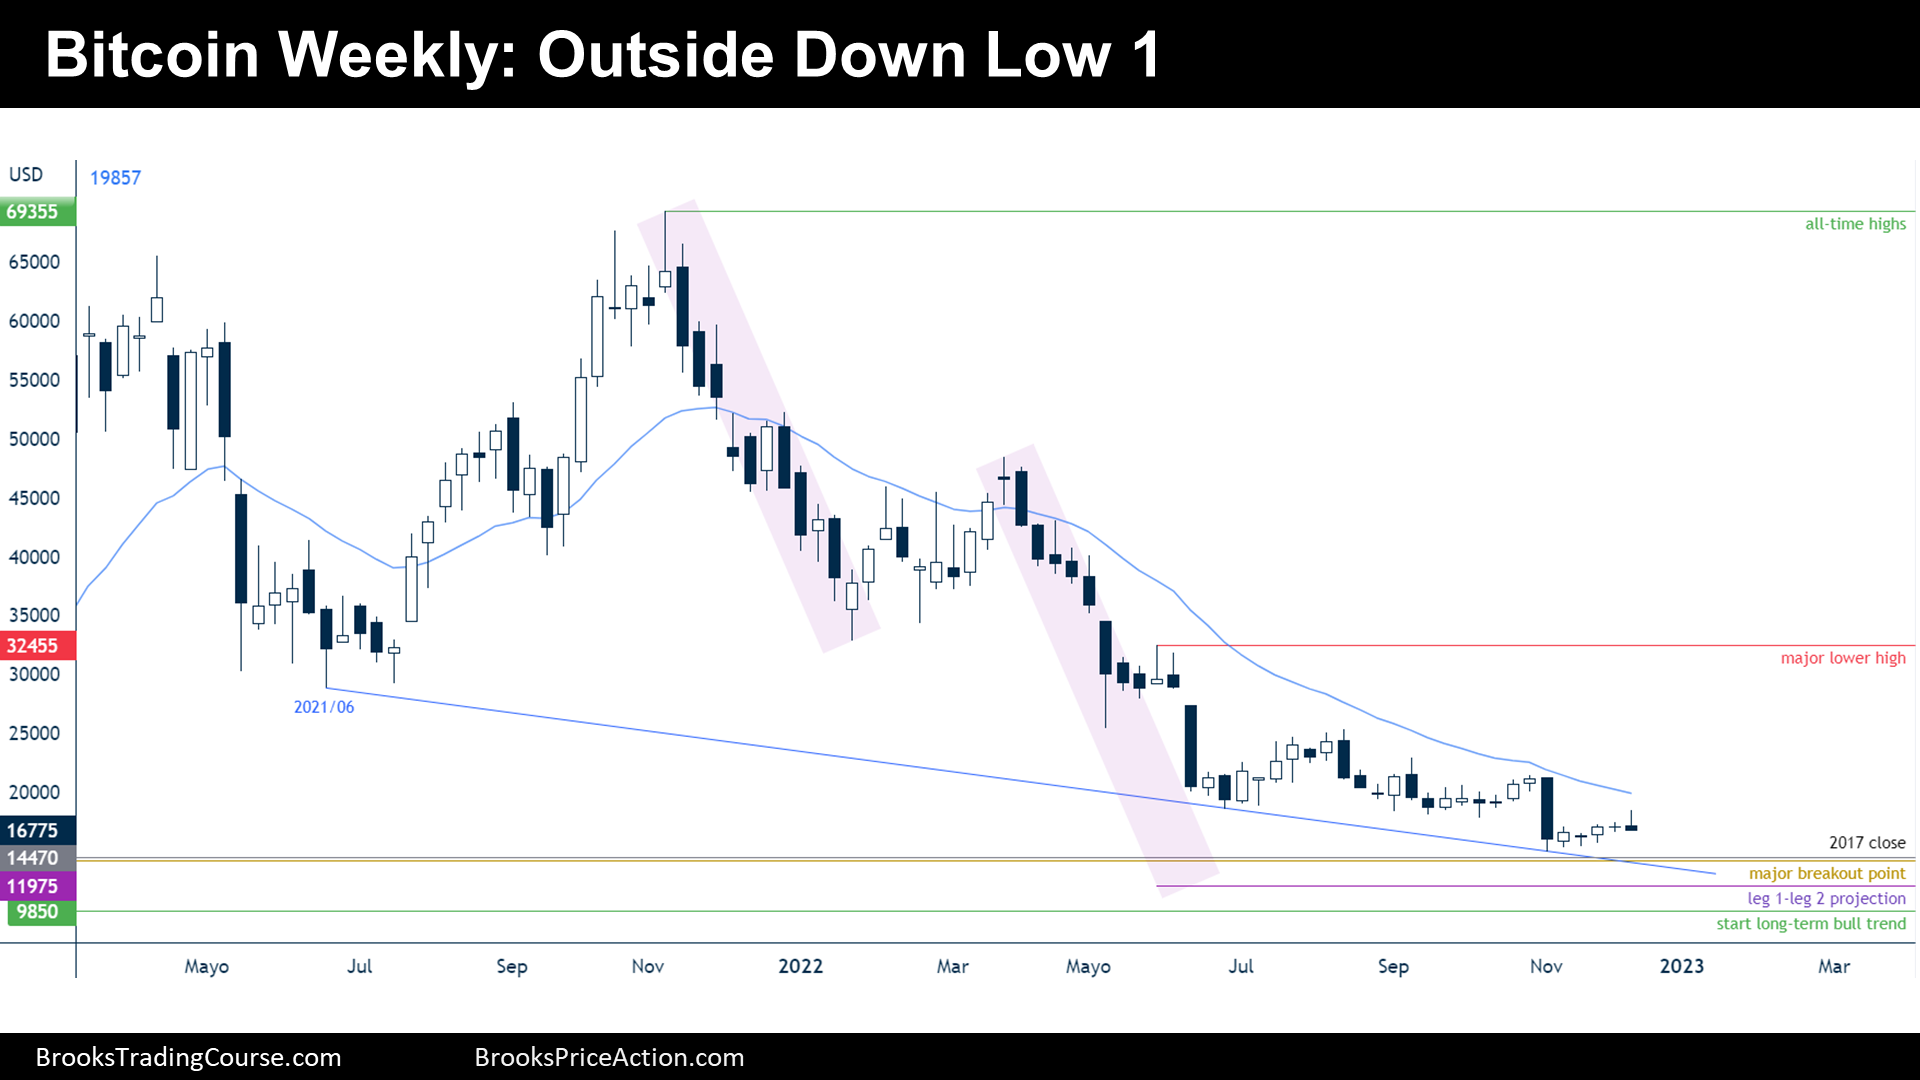
Bitcoin futures begun the week trading higher and then, by the end of the week, reversed down – a Bitcoin outside down bar. The year is about to end and the bears -that controlled the price action during 2022- want to close at the lows.
Bitcoin futures
The Weekly chart of Bitcoin futures

- This weekly candlestick is a Bitcoin outside down bar. It is also a low 1 in a bear trend. It is a sell setup for the next week.
- Since June, there has been a sideways to down trend.
- Bulls think that this pattern is a final flag. They have the conviction that the strong supports around will stop a serious bearish advance.
- Bears believe that the trend might be strong enough to stop the long-term bull trend, by trading at around $10000 at some point.
- The bear trend that begun at the all-time highs has already 3 legs; hence, traders believe that it might be too cheap to keep selling here. Bears will have a better probability if they wait to sell higher, specially at the June 2021 low or at around the major lower high.
- As I have been saying during the past 6 months, I believe that there are bulls trapped below the June 2021 low. Because buying there was a reasonable thing to do, there is a great chance that the price will come back there at some point.
- Because there is a bear setup within a bear trend, traders should expect lower prices during the next week. A test to the 2017 close or to the major breakout point might be underway.
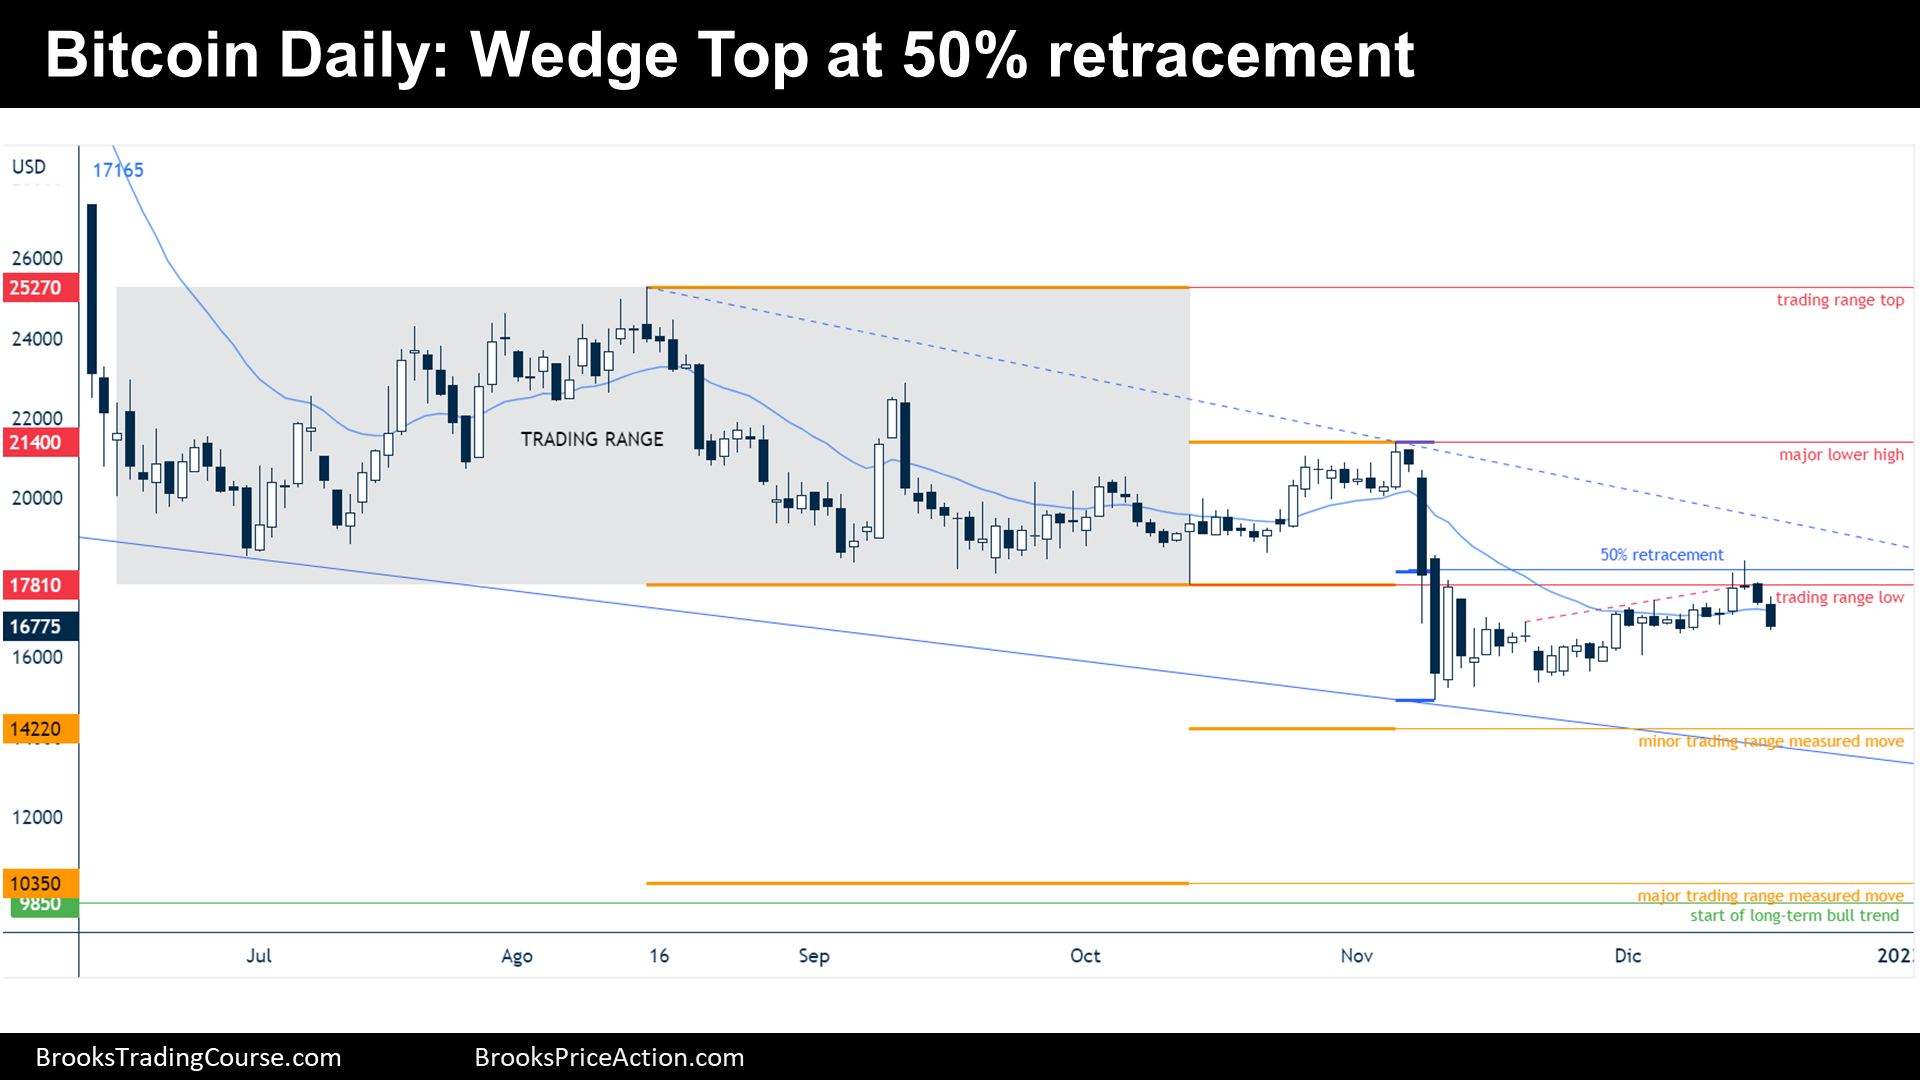
The Daily chart of Bitcoin futures

- The price formed a wedge top that stalled at resistances (a 50% retracement and the prior breakout point/trading range low). There, it created a reversal bar and two good bear bars followed. Friday is a good sell signal bar for Monday.
- The odds are that there will be lower prices. After a wedge top, traders expect, at least, two legs sideways to down. A new low of the year might be underway.
- But the price was sideways trading during the past 20 bars, and during sideways trading, breakouts tend to fail.
- The target for the bears are new lows, and to get to the minor trading range measured move. Considering the current momentum, the major target (which is the major trading range measured move) seems too far.
- The bulls do not have good reasons to buy right now, but they might enter the scene if there is a good bull bar that could create a double bottom higher low with November lows. For now, it looks hard for them to stop, technically, the broad bear channel, which would occur if the price trades up to the major lower high.
- Because the bears got 3 consecutive bear bars, traders expect lower prices during the next week.
Market analysis reports archive
You can access all weekend reports on the Market Analysis page.
Never mind, that low was exceeded.
Is it possible that the large, 2 day sell off on Nov 8-9 represents seller exhaustion and a low for this bear?
Hola Greg! Excellent question, thank you.
I think it is either exhaustion or a weak bear trend (broad channel, hence, trading range). Immediately after that sell off, the price quickly reversed (Nov 10) closing the gap between the breakout low and the breakout point of the trading range. That means that the bulls who bought below the trading range low and scaled in lower, made money. Moreover, it means that the bears that sold the sell-off were not as strong enough to form a strong bear channel: the price went sideways.
We do not know whether that is the final low or not, but it is definitely an ok candidate. What we do know is that if bulls make money buying below lows and scaling in, they will try to exploit that strategy again. Bears know that and will take quick profits.