Market Overview: Crude Oil Futures
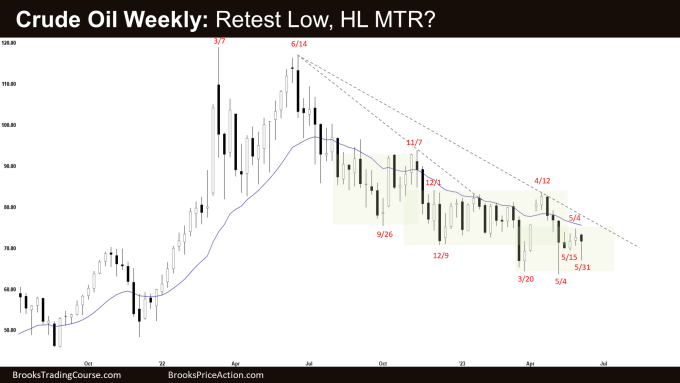
The Crude oil futures formed a weak second leg retest of May low on the weekly chart. The market traded lower but reversed higher to close above the middle of the weekly candlestick with a long tail below. The bears hope to get follow-through selling next week and a retest of the May low. The bulls want a reversal from a double bottom (Mar 20 and May 4) and a higher low major trend reversal (May 31).
Crude oil futures
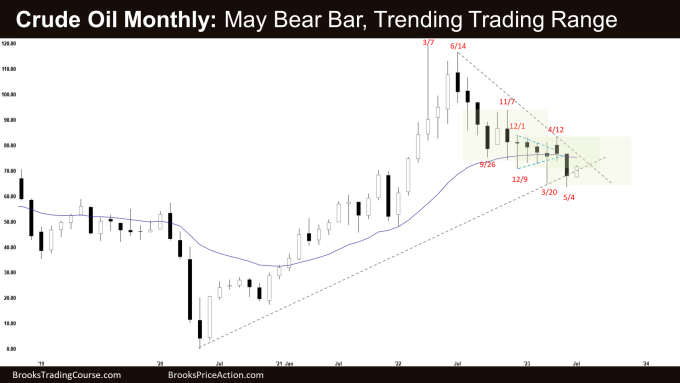
The Monthly crude oil chart

- The May monthly Crude Oil candlestick was a big bear bar closing in the lower half with a prominent tail below.
- Last month, we said that the market is in a tight trading range and traders will BLSH (Buy Low, Sell High) in trading ranges until there is a strong breakout from either direction with follow-through buying/selling.
- May broke below the tight trading range and retested the March low but reversed to close above it.
- The bears hope that April formed another lower high. They got a reversal down from a double-top bear flag (Dec and April).
- While June is currently trading higher, they hope that it is simply a pullback and want another retest and breakout attempt below the March low.
- The bulls want a reversal up from a wedge bottom (Dec 9, Mar 20 and May 4) and a double bottom (Mar 20 and May 4).
- They hope that the strong selloff in May is simply a sell vacuum retest of the March low and want a reversal up from a lower low major trend reversal.
- However, they have not yet been able to create credible buying pressure (strong bull bars) still.
- The bulls will need to create strong bull bars with follow-through buying, trading far above the trading range high (Dec), the bear trend line and the 20-month exponential moving average to convince traders that a reversal up could be underway.
- The market has been forming a trending trading range.
- The candlesticks are overlapping sideways therefore the market remains in a trading range.
- Traders will BLSH (Buy Low, Sell High) in trading ranges until there is a strong breakout from either direction with follow-through buying/selling.
- Reversals and poor follow-through are common within a trading range.
- For now, odds slightly favor the trading range to continue.
The Weekly crude oil chart

- This week’s candlestick on the weekly Crude Oil chart was a bear doji with a long tail below.
- Last week, we said that traders will see if the bulls can create another follow-through bull bar testing the 20-week exponential moving average or will the bears be able to create a retest of the May 4 low.
- This week attempted a retest of the May low but did not get close before reversing up to close in the upper half of the week’s range.
- The prior move down was in a 6-bar bear microchannel. That means strong bears.
- The first pullback (bounce) from such a strong bear micro channel often is minor. That was the case this week.
- The bears got another leg down testing the May 4 low, but it fell short and the week reversed to close above the middle of the range. The bears are not as strong as they hope to be.
- They hope to get follow-through selling next week and a retest of May low.
- The bulls want a reversal from a double bottom (Mar 20 and May 4) and a higher low major trend reversal (May 31).
- They hope that the strong selloff from April 12 is simply a sell vacuum test of the trading range low and that this week was simply a weak second-leg retest of the low.
- They will need to create consecutive bull bars breaking far above the 20-week exponential moving average and the bear trend line to increase the odds of higher prices.
- Buy Vacuum and Sell Vacuum within a trading range can make the range extremes test appear very strong, but the breakout is more likely to fail.
- The market is in a 28-week trading range. Traders will BLSH (Buy Low, Sell High) in trading ranges until there is a strong breakout from either direction with follow-through buying/selling.
- Poor follow-through and reversals are common within a trading range.
- Since this week close in the upper half of the week’s range, it is a buy signal bar for next week, albeit slightly weaker.
- The bulls need to create follow-through buying next week to increase the odds of the bull leg within the trading range beginning.
- If the bulls get a decent follow-through bull bar, the odds of a retest of the trading range high (April high) will increase.
Market analysis reports archive
You can access all weekend reports on the Market Analysis page.