Trading Update: Friday October 7, 2022
Emini pre-open market analysis
Emini daily chart
- The bears got an inside bar yesterday, closing near its low. This creates a second entry short after the prior days outside the up bar. The bears want to trigger the short and want strong entry bar and successful bear breakout below the June low.
- The bears want a selloff and break below the June low; however more likely that any selloff will be a pullback, and the market will get a second leg up.
- With yesterday being a second entry sell, it will cause some bulls to exit and look to buy after the reversal attempt.
- Since the market is at the bottom of a trading range, traders have to be open to this second entry short being a bear trap and leading to an upside breakout. It is common to get a trap just before a bull breakout of a bear flag. This causes bulls to be trapped out of the buy and bears into the short (yesterday’s 2nd entry).
- More likely, today will disappoint both the bulls and the bears.
- Today is an essential bar since it will likely be the entry bar for yesterday’s 2nd entry short. The bears will try their best to get today to close near its low, and the bulls want the opposite.
- The bulls have open gaps, such as the September 28 high, and they will try and keep this gap open. If they can keep it open, it increases the odds that the bulls will be able to get the upside breakout and test of 4,000.
- While the odds favor the bulls, the bears still have a reasonable chance of getting a successful bear breakout below the June low. With yesterday’s 2nd entry sell, one has to assume the bears have a 40% chance of a bear breakout below the June low. Is it closer to 30% than 40%? Who knows, but the point is that the risk is real for the bulls getting trapped here.
- Today is Friday, so the weekly chart is important. The bears have three consecutive bear bars on the weekly chart, and the bulls are trying to close above last week’s bear bar. The first reversal on the weekly chart will probably be minor, which means sideways is most likely. The bulls want to close above last week’s high, and the bears want to keep the market below it.
Emini 5-minute chart and what to expect today
- Emini is down 30 points in the overnight Globex session.
- The unemployment report was just released at 5:30 AM PT, leading to a strong bear breakout.
- The market will gap down today.
- While a gap down increases the odds of a bear trend day, traders should expect sideways trading to the moving average and a limit order market on the open.
- This means that most traders should wait for 6-12 bars before placing a trade and assume that most breakouts will fail on the open.
- Traders can also consider waiting for a credible double top/bottom or a wedge top/bottom before placing a trade.
- Traders should pay attention to the open of the day as well as the midpoint of the day. This is because today will be the entry bar for the 2nd entry sell on the daily chart, and the bull will try their best to disappoint the bears.
- Today is Friday, so the weekly chart is important. There is an increased risk of a surprise breakout up or down late in the day as institutions fight over the close of the weekly chart.
Yesterday’s Emini setups

Al created the SP500 Emini charts.
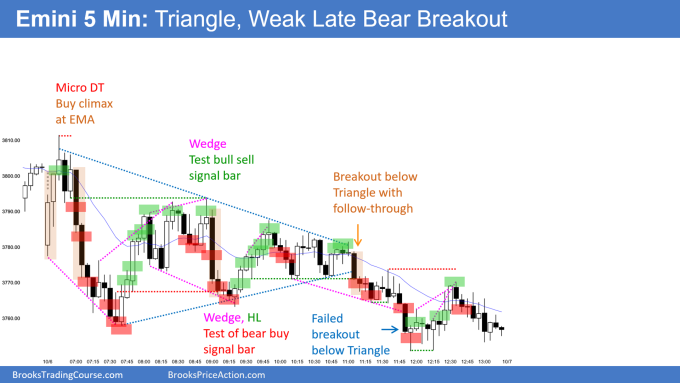
Here are several reasonable stop entry setups from yesterday. I show each buy entry with a green rectangle and each sell entry with a red rectangle. Buyers of both the Brooks Trading Course and Encyclopedia of Chart Patterns have access to a much more detailed explanation of the swing trades for each day (see Online Course/BTC Daily Setups).
My goal with these charts is to present an Always In perspective. If a trader was trying to be Always In or nearly Always In a position all day, and he was not currently in the market, these entries would be logical times for him to enter. These therefore are swing entries.
It is important to understand that most swing setups do not lead to swing trades. As soon as traders are disappointed, many exit. Those who exit prefer to get out with a small profit (scalp), but often have to exit with a small loss.
If the risk is too big for your account, you should wait for trades with less risk or trade an alternative market like the Micro Emini.
EURUSD Forex market trading strategies
EURUSD Forex daily chart

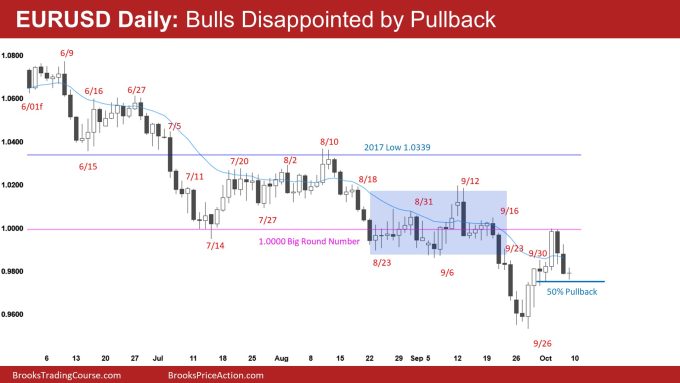
- The pullback over the past two days is disappointing for the bulls and increases the odds of more sideways price action.
- October 4 was a reasonable buy-the-close bar; the market should test this close soon. Typically, when you buy the close of a good bar and are disappointed (October 5), the market will give you a chance to exit breakeven. This makes me think the market will have to test the October 5 close and that the current selloff is minor.
- The bears see October 4 as exhaustion and a 2nd leg trap on a smaller time frame. The problem with this argument is how tight the channel is.
- The market will probably have to get up to the September 20 and September 12 highs since this was the start of the exhaustive leg down.
- The past two days are enough of a surprise that the market may need a second leg down before the bulls can get a rally up to October 14.
- Overall, traders should expect sideways to up over the next few days and a test of the October 4 close. Less likely, the past two trading days start an endless pullback that breaks below the September low.
Summary of today’s S&P Emini futures price action and what to expect tomorrow

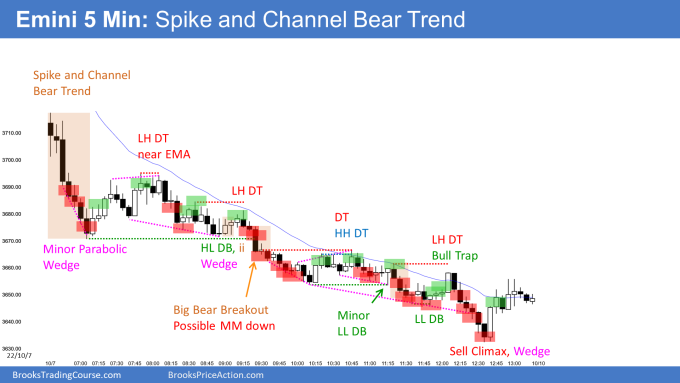
Al created the SP500 Emini charts.
End of day review
- I will update at the end of the day.
See the weekly update for a discussion of the price action on the weekly chart and for what to expect going into next week.
Trading Room
Traders can see the end of the day bar-by-bar price action report by signing up for free at BrooksPriceAction.com. Al talks about the detailed S&P Emini futures price action real-time throughout the day in the BrooksPriceAction.com on trading room days. We offer a 2 day free trial.
Charts use Pacific Time
When times are mentioned, it is USA Pacific Time. The Emini day session charts begin at 6:30 am PT and end at 1:15 pm PT which is 15 minutes after the NYSE closes. You can read background information on the market reports on the Market Update page.
I’m starting to wonder if Monday & Tuesday was a second leg bull trap of an ABC two-leg pullback that started on the low of 9/27 and where the B went below the start.
It’s time we accept the market is no longer Bull
As Al says, don’t be in denial
Brad, I think your’re prolonging the TR thesys too much.
It’s time we consider sp500 may be in bear trend.
If 30 september low does not hold, there’s no TR. Seems the bull wedge is falling and can accelerate down.
I said that because I always read you blog, and I feel that you always search reasons for the Bull case. It seems that you like being Bull.
Market not stop falling 🙁
SP500 weekly chart, gaps closing, TR price action.
EURUSD weekly chart, gaps open, trend.
I think that if Brad always searches for a Bull case is because, as Al teaches, we should be always looking for both the bull and bear case.
If you look at the weekly chart, the S&P is at the bottom of the channel that followed the spyke up after the “covid low” (March 2020), so an important area. Plus, we are very close to reach a 50% pullback with that low, there is a pretty clear W in place and we are at a MM from the HL DT from March the 28th. So maybe we are in an area that is a good candidate to be the TR Low. Can we instead accellerate down? Sure, but what Brad is probably trying to say is that this scenario is low probability.
The reason I sound so bullish is that the market is either in a bull trend or a trading range on the monthly/weekly chart. I have said several times over the past few weeks that the bears have a case for getting a successful bear breakout below the trading and a 300-point sell-off down to the 2020 Pre-pandemic high.
The one fundamental problem either the bear trend concept is even if the market sells off to the pre-pandemic highs since the monthly chart would still be in a bull trend or a trading range, investors would be happy to buy at such a big discount.
But you are correct In saying something is wrong with the bull case here. One has to ask why was Friday such a big bear bar after the recent two strong bull bars. It is a sign of strength by the bears.
It is a broad bear channel in the SC zone thus expecting a sort of bull presence at that PA area is more than reasonable, yet you might not get it. You can expect a bull leg but as long as bulls have not created decent close and test of the bear trend line, we are not in a bull trend.