Trading Update: Thursday December 8, 2022
Emini pre-open market analysis
Emini daily chart
- The Emini daily chart now has a 5-bar bear micro channel after testing the November 30 low and the November 1 breakout point high.
- Since yesterday is an inside bar in a trading range, the sellers may not come in until the market reaches the December 6 high, which was a strong bear close, as the Emini may need test of December 6 high.
- The odds favor at least a small second leg down after the 5-bar bear micro channel. This means trades will likely look to sell the first reversal up.
- The bears saw November 30 as a third push-up and an upside breakout of a tight trading range late in the rally from the October low. Tight trading ranges late in a rally are often final flags, and the market typically will reverse back into the apex (midpoint) of the tight trading range.
- The bulls see the selloff over the past five trading days as a test of the November 1 breakout point high. They want to keep this gap up and the market to reverse up strongly.
- The market will likely get a close below the November 1 high, ending the argument of a measuring gap.
- The bears have a chance of getting a downside breakout and testing the November lows, although sideways is most likely over the next couple of weeks.
- The most crucial thing to remember is that the market is in a trading range. This means traders will expect the market to rally for a couple of legs, reverse and sell off for a couple of legs. It is important not to become hopeful and better to assume that all breakouts will fail and lead to disappointment until there is reason to believe otherwise.
- With less than a month left in the year, traders need to consider where the market might be trying to close on the year. The first logical price level is 4,000. It has been an important round number for more than half of the year. The market is also so close to it that it may be unable to escape the magnet field of 4,000. This increases the risk that the next couple of weeks will not go that far up or down.
- Another target is the midpoint of the year (4,237). However, the market may run out of time this month and may not be able to reach it.
Emini 5-minute chart and what to expect today
- Emini is up 22 points in the overnight Globex session.
- The Globex market formed a double bottom (early this morning) below yesterday’s low and has been in a tight bull channel ever since.
- Traders should expect the market to try and get above yesterday’s high during the U.S. Session.
- As always, traders should expect a trading range open and a limit order market. This means traders should consider not trading for the first 6-12 bars.
- Traders can also wait for a credible stop entry in the form of a double top/bottom or a wedge top/bottom before placing a trade.
- As stated above, the market may have to test the December 6th high before sellers come in on the daily chart, which means today has the potential to rally.
Yesterday’s Emini setups

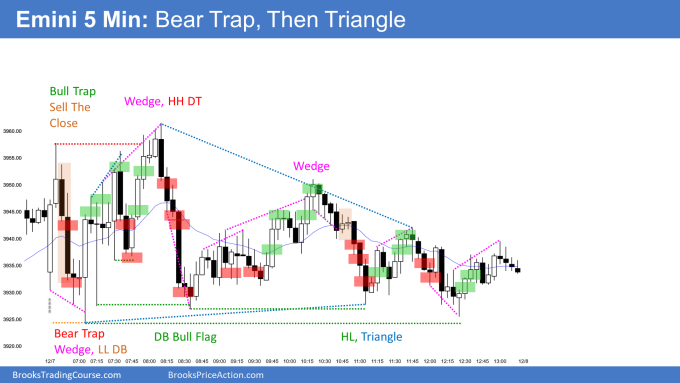
Al created the SP500 Emini chart.
Here are several reasonable stop entry setups from yesterday. I show each buy entry with a green rectangle and each sell entry with a red rectangle. Buyers of both the Brooks Trading Course and Encyclopedia of Chart Patterns have access to a much more detailed explanation of the swing trades for each day (see Online Course/BTC Daily Setups).
My goal with these charts is to present an Always In perspective. If a trader was trying to be Always In or nearly Always In a position all day, and he was not currently in the market, these entries would be logical times for him to enter. These therefore are swing entries.
It is important to understand that most swing setups do not lead to swing trades. As soon as traders are disappointed, many exit. Those who exit prefer to get out with a small profit (scalp), but often have to exit with a small loss.
If the risk is too big for your account, you should wait for trades with less risk or trade an alternative market like the Micro Emini.
EURUSD Forex market trading strategies
EURUSD Forex daily chart

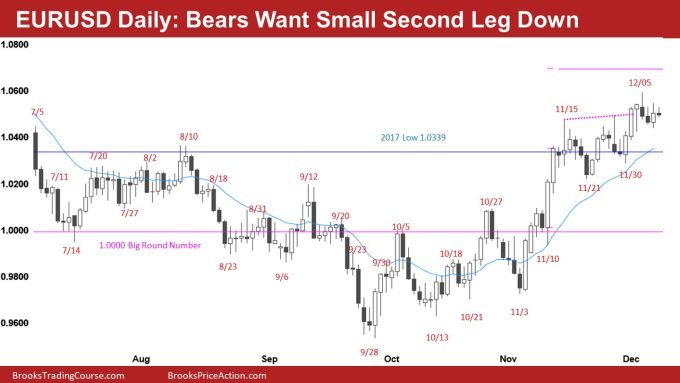
- The EURUSD has been in a bull channel since November 21 and now has a wedge top with December 5.
- The bears, at a minimum, expect two legs down from the wedge top, and they want a test of the November 30 high.
- The bulls want the market to reach the November 10 and 11 bull breakout measured move target above (purple line). Even though the measured move target seems far away, the market may have to get there due to the strength of the two-bar bull breakout on November 10 and 11.
- Although the bears see a wedge top with the December 5 high, the channel up is tight, and the December 5 sell signal follows three consecutive bull bars, lowering the probability of the bears.
- Even though the December 5 sell signal bar is in a tight channel, bears will still sell below it and scale in higher. This increases the odds that the market will retest the December 5 low even if the market first reaches the bull measured move target above (purple line).
- Overall, traders should expect the market to continue sideways as bulls try for the upside breakout and bears try for the test of the November 30 low.
Summary of today’s S&P Emini futures price action and what to expect tomorrow

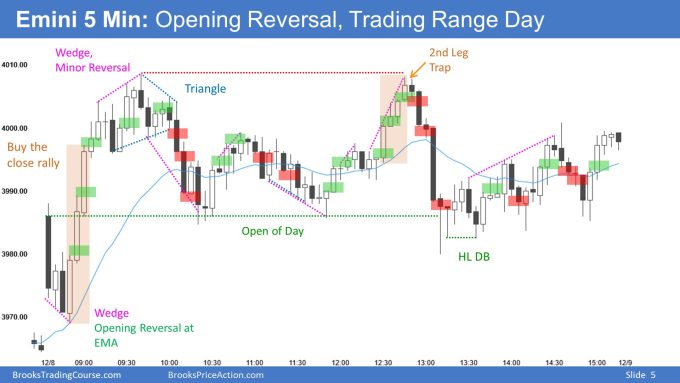
Brad created the SP500 Emini chart.
End of day review
- I will post End of Day video soon.
See the weekly update for a discussion of the price action on the weekly chart and for what to expect going into next week.
Trading Room
Traders can see the end of the day bar-by-bar price action report by signing up for free at BrooksPriceAction.com. Al talks about the detailed S&P Emini futures price action real-time throughout the day in the BrooksPriceAction.com on trading room days. We offer a 2 day free trial.
Charts use Pacific Time
When times are mentioned, it is USA Pacific Time. The Emini day session charts begin at 6:30 am PT and end at 1:15 pm PT which is 15 minutes after the NYSE closes. You can read background information on the market reports on the Market Update page.
Sometimes the expired contracts making up a continuous chart are back adjusted by the software to match the new contract and that may change the yearly H & L. It’s one of the quirks of trading futures. I often use the cash (like SPX) for longer term charts which avoids the issues with continuous futures charts.
Hi Brad, thanks for the chart analysis. What’s the significance of the HL DB at 13.30? Often see such examples and LH DT in the daily setups, but not sure what they mean. Perhaps you could let me know which course video to refer to.
Shiela Ji,
There are 2 good videos under “Support, Resistance, and Basic Patterns” there you may consider watching “Double Tops and Bottoms” . Hope that helps
Regards
Raj
Brad hey, thanks for the report. Your 5m chart show HOD @ nearly 4010 which is not the case. Thoughts?
Hi Eli
Yesterday the Es rolled over to the next month’s contract, so different traders’ charts will not have same numbers as others, depending on whether they use the ‘continuous’ contract. So, its not important.
Hi Brad,
Thanks for the nice analysis, I am new to this site and futures are also new to me , for past few days I am trying to understand your report. I have few suggestions
1) I think adding a daily chart will be helpful to understand your daily chart analysis
2) About “Emini 5-minute chart and what to expect today” I think adding a 5 minute chart will be helpful here as well.
Regards
Raj
Thank you for your feedback. I would like to add a daily chart, but the problem is time. A lot goes into these reports on the back end, even after the report is typed which makes adding too many charts problematic. I will look into adding an occasional daily chart though.
Be sure and check out the Weekend Blog post as they will include a daily chart as well.
Thanks Brad appreciate your efforts for this report
Hi Brad,
I was curious as to how you calculated the midpoint of the year at (4,237). I have the high on 1/4 at 4820 and the low on 10/13 at 3502. This puts my midpoint at 4161. I am calculating this data from a E-Mini futures chart.
Thanks for all your posts this year. Happy Holidays
Robert
Hi Robert,
I made an error on my end miscalculated, I also did not realize TradeStation’s continuous chart rolled over to the March contract, so the prices changed.
The Day only “ES.D” for TradeStation March 22 contract shows Jan 4th High of 4,8489.5 and the October 13 low as 3,533.00 with a midpoint of 4,191.25