Trading Update: Wednesday June 1, 2022
Emini pre-open market analysis
Emini daily chart
- The three consecutive bull breakout bars are strong enough for a second leg up and possible measured move up that would project to around the April 18 low.
- Bears hope that the three consecutive bull bars are a 2nd leg trap that will trap bulls into buying too high. The rally up to May 17 is the first leg, and the or the May 23 is the first leg, followed by the rally up to May 26 being the second leg up.
- Traders do not care that May 17 was followed by a new low and may view it as part of the two-legged pullback creating the second leg trap.
- If this is going to be a second leg trap, the bulls may get a small second leg up and a bear bar closing on its low. That would create a micro double top, possibly enough to disappoint the close bulls who bought on May 27.
- Second, bull traps like May 27 are common in trading ranges and bear channels. Even if May 27 is a 2nd leg trap, the market may sell off to the May 25 low and go sideways. Successful 2nd leg bull traps often form trading ranges and do not go far below the second leg.
- The market is at the nine-month trading range low. The bulls want a rally back into the middle of the 9-month trading range. They hope the rally is strong enough to make traders question if the market will reach a new all-time high.
- While a new all-time high is possible, it is not likely. The market has entered a trading range on the daily chart, which means the bulls will likely get a couple of legs up after the recent three consecutive bull bars, and the bears will try to reverse the market back down. Even if the bulls get a measured move up to the April 18 low, the bears will still try and turn the market down and form another lower high.
- Yesterday was the final day of the month. The monthly chart closed as a doji bar. This is a sign of the market becoming neutral and increases the odds that there might be sellers above last month’s high, which is consistent with what the daily chart tells us.
Emini 5-minute chart and what to expect today
- Emini is up 20 points in the overnight Globex session.
- The market has been in a broad bear channel for most of the Globex session and has recently rallied close to the Globex high (4,156.75). If the market does not reach this price level during the Globex session, it will likely have to reach it during the day session.
- At the moment, the bulls will get a gap up.
- Traders should expect a trading range open and be cautious about buying too high or selling too low.
- In general, most traders should consider waiting for 6-12 bars before placing a trade.
- Since the market will likely have a lot of limit order trading on the open, traders should consider waiting for a credible stop entry such as a wedge bottom/top, double bottom/top, or a strong breakout with follow-through.
Yesterday’s Emini setups

Brad created the SP500 Emini charts.
Here are several reasonable stop entry setups from yesterday. I show each buy entry with a green rectangle and each sell entry with a red rectangle.
My goal with these charts is to present an Always In perspective. If a trader was trying to be Always In or nearly Always In a position all day, and he was not currently in the market, these entries would be logical times for him to enter. These therefore are swing entries.
It is important to understand that most swing setups do not lead to swing trades. As soon as traders are disappointed, many exit. Those who exit prefer to get out with a small profit (scalp), but often have to exit with a small loss.
If the risk is too big for your account, you should wait for trades with less risk or trade an alternative market like the Micro Emini.
EURUSD Forex market trading strategies
EURUSD Forex daily chart

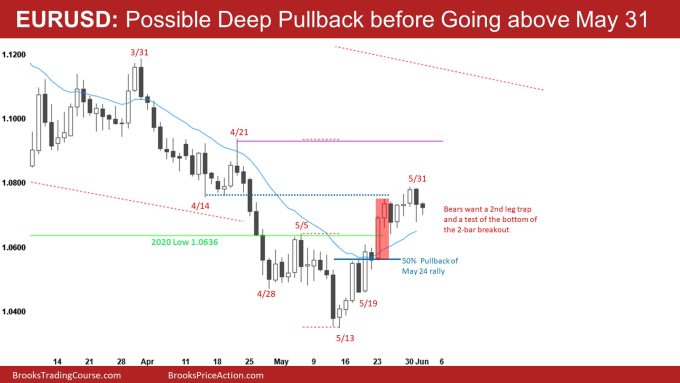
- Yesterday was the final trading day of the month. The bulls have a bull bar closing on its high for the monthly chart, which increases the odds that the market will have to go above it soon.
- This means the market will likely have to go above the May 31 high regardless of if the market has a 50% pullback of the May 13 to May 31 rally first.
- I have stated in the last report that the market may have to have a selloff and form a higher low major trend reversal before going much higher. The reason for that is, as strong as the current rally looks, there are a lot of bear bars which increase the odds of a pullback soon.
- The channel up to May 31 is tight, and it is a small pullback bull trend. The May 25 low and May 19 high may be a measuring gap that projects the market up to the April 21 high.
- The market is also at the 2-month trading range low (April 14), which is a logical resistance level to have a pullback.
- Over the next couple of days, the market will decide between triggering the monthly chart buy signal by going above the May 31 high or having a pullback first, which would form a high low major trend reversal and trigger the May 31 high. Most traders would prefer the market to have a pullback and create a higher low before going above May 31.
- One final note is if the market does get a pullback before triggering the May 31 high, it is possible that the market has to test last month’s bear close (1.0547). There are disappointed bears who sold the previous month’s close, and if the market tests back to their entry price (1.0547), they would be happy to buy back shorts at breakeven or with a small loss.
Summary of today’s S&P Emini futures price action and what to expect tomorrow

Brad created the SP500 Emini charts.
End of day summary
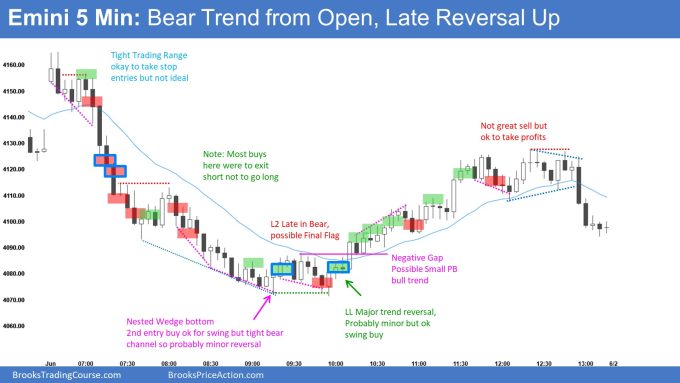
- Today was a bear trend from the open that had a late reversal up.
- The market gapped up and went sideways for the first 6 bars, then the bears got a bear breakout down to yesterday’s low.
- The bear breakout was strong enough to lead to a couple of legs down and a wedge bottom around 9:00 PT.
- The bulls got a lower low major trend reversal that led to a small pullback bull trend for the rest of the day.
- It is essential to remember that when there is a trend from the open, the odds are 60% that the market will form a trading range at some point during the day.
A more detailed discussion is below:
- The market went sideways on the open and formed a second entry sell at 7:00 PT.
- Bulls who were buying with limit orders betting on an early low were quickly trapped during the 7:10 bar. The 7:10 close makes the market clearly always in long, although some traders would have waited for follow-through.
- By 7:15, the market was sell the close, and the bears had at least a 60% chance of a second leg down and a possible measured move down of the past two consecutive bear bars.
- 7:20, the market was sell the close, and some bears would bet on a measured move of the past three consecutive bear bars, which projects down to 4,076. At 7:20, the market had been sell the close for arguably four bars, which increased the odds of a pullback soon.
- The bulls had a two-legged pullback up to 8:00. However, the bears had a 9-bar bear microchannel with three strong bear closes, which was too much selling pressure to be looking to buy.
- The bears formed a L2 at 8:00 that was also a double top, and the market sold off for a measured move down based on the 8:00 high to the 7:40 low, projecting to around the 9:05 low.
- The market formed a nested wedge bottom with a second entry buy around 9:15. However, the channel down was tight, so the first reversal was likely to be minor.
- The bulls formed a lower low major trend reversal at 9:55 that ended up leading to a major reversal in the form of a small pullback bull trend.
- The rally up from 10:00 looked like a minor reversal; however, the bulls formed an 8-bar bull micro-channel up to 10:30. This is a sign of strength by the bulls and a warning that the market may be forming a small pullback bull trend. The bulls also created a negative gap with the 9:35 high and 10:15 low.
- One the daily chart, some bulls were disappointed by yesterday’s doji bar and would use today to exit back at the breakeven price (they bought on 4,155.75 on 5/27/22). The bulls still hope that the three consecutive bull bars on the daily chart will lead to a measured move up and the bears hope today is the start of the 2nd leg bull trap (see above daily blog comments for more details).
See the weekly update for a discussion of the price action on the weekly chart and for what to expect going into next week.
Trading Room
Traders can see the end of the day bar-by-bar price action report by signing up for free at BrooksPriceAction.com. Al talks about the detailed S&P Emini futures price action real-time throughout the day in the BrooksPriceAction.com on trading room days. We offer a 2 day free trial.
Charts use Pacific Time
When times are mentioned, it is USA Pacific Time. The Emini day session charts begin at 6:30 am PT and end at 1:15 pm PT which is 15 minutes after the NYSE closes. You can read background information on the market reports on the Market Update page.
Thanks for the report Brad! The charts you’re posting and the detailed discussion thereafter are immensely helpful. A couple of questions if you could consider –
Since the low placed today at around 10 PT appeared minor that turned out to be major, and the market thereafter started failing near the 50% PB area of the selloff from the morning 7 PT, do you think the odds are in favor of the market trying to test back down to today’s low and attempt a major MTR or a TR?
Also, does a beginner take the 10 PT buy?
The 10PT buy is a credible swing buy, so it is reasonable to trade and hold betting for at least 2x risk. It could be considered one of those Walmart trades that Al talks about (take the trade, enter bracket orders, go to Walmart, and come back in an hour).
The problem with 10 PT is that the major trend reversal setup did not have enough bars, which increased the odds of any rally after 10PT being minor.
The rally after 10PT was major. However, some traders would still want to see a retest, which is partly why the market sold off at the end of the day. This may set up some kind of Higher low Major trend reversal tomorrow. So yes, I agree with you regarding the late selloff as a test of the lows.
Got it. Thanks. That was helpful.
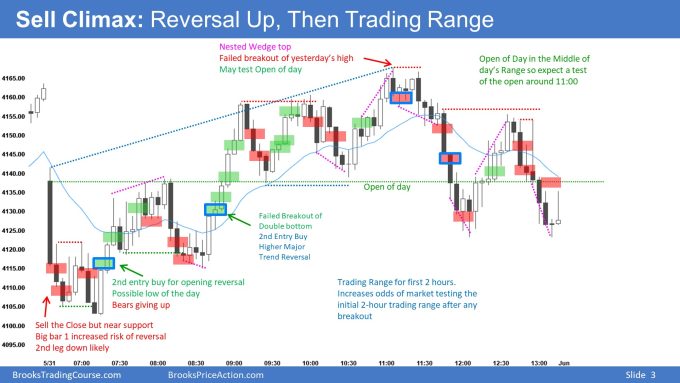
Hey Brad the notes on the chart are super helpful… thanks for adding them. Had a question about the open today specifically bar 2. I figured a big outside down bear bar closing on its low after a micro DT near yesterdays TR day high would be enough for always in short. Was it a pass because the ema was close below? Would you need another consecutive bear bar following bar 2 to confidently short there?
Thanks
Bar 2 is a tricky situation. It might have been strong enough to make the market always, in short. However, most traders would want to see one more bar. Had bar 3 been another equally strong bar, especially if it closed below the moving average, the market would have been sell the close.
Another problem with bar 2 is what do traders do if bar 3 closed on its high? That would create a gap up and H2 buy, which might be enough for bears to exit.
In general, look over Al’s charts daily chart setups, and you will notice the market is Always in on the open when one side can get two consecutive trend bars (assuming the context is reasonable).
Bar 2 was a 1 tick failure above bar 1 creating DT with previous day high and closed at the low so it was L1 sell signal bar and reasonable swing short. From Al’s 3rd book page 228 ” A one tick failure is a reliable sign that the market is going the other way, so look for setups that allow you to enter”.
Thanks Brad. Can I ask why the close of bar 8 was not a sell? I realize that the support was close but I would have thought such a strong bear close after so many bear bars would be a sell signal.
Bar 8 is a sell the close bar, and traders will sell it’s close and below it. The end-of-day chart above only reflects stop entries to try and limit markings on the chart. It can get cluttered quickly.
Hey, Brad. I think Leo is talking about 5/31 bar 8 here and not 6/1 bar 8. I am assuming you were talking about 6/1 given how you did not mark a sell below 5/31 bar 8.
That’s correct Abir. Thanks for confirming.
Hi Leo,
Bar 8 is not ideal because of the risk of an opening reversal up. Also, it is a possible second failed breakout of Friday’s 8:05 PT higher low.
Also, if you ignore bar 1 (pretend bar 1 is just part of the gap down) from the open, the first 6-7 bars are trading range bars which increases the odds of a breakout below bar 3 failing.
If one did sell 8, they get out on the next bar.
Hope that helps