Market Overview: Weekend Market Update
The Emini selloff is in search of a bottom of its 5 week bear leg in its 18 month trading range. A reasonable target is the gap above the February 11 high. Also, a 50% retracement of the 2019 rally would be about a 10% correction. The bulls will then probably get another test of the all-time high within a couple months.
Crude oil is selling off sharply but it is entering the buy zone. The rally will probably be minor, last 2 – 3 weeks, and test $60.
The EURUSD Forex market has been in a bear channel for a year. Protracted bear channels often end with a sharp break below the channel and then a reversal up. There is no sign yet that the pattern of 2 – 3 week rallies and 2 – 3 week selloffs is about to end.
Crude oil Futures market:
Strong bear breakout, but support at $52
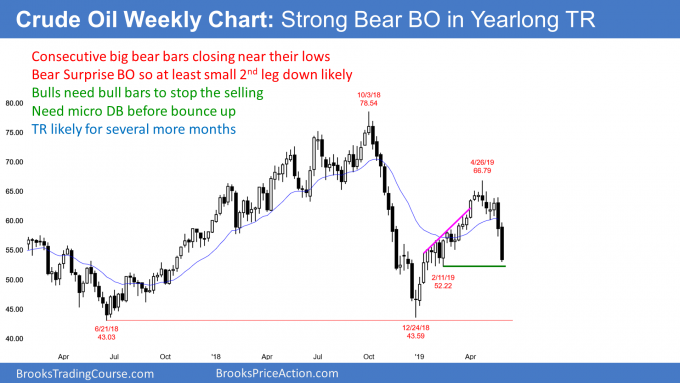
The crude oil futures contract sold off sharply over the past 2 weeks. For the 6 weeks, I have been saying that the selloff might continue down to the January 14 low of 51.61. That was the 1st pullback on the daily chart from the strong reversal up from the end of December. It was therefore the start of the bull channel in a 4 month Spike and Channel bull trend.
I said repeatedly in March and April that there is typically a bear break below the bull channel and then a transition into a trading range. The bottom of the range is often around the start of the bull channel. But, it could be higher or lower.
There are two scenarios that are unlikely. First, crude oil’s 2 month selloff will probably not continue down to the Christmas low without at least a several week rally. The selloff is probably a bear leg in a developing trading range and not the start of a bear trend.
Next, once there is a reversal up, it will probably not continue up to the October high with at least a pullback lasting several weeks. Remember, the entire 2019 rally was probably the start of a trading range that could last for the rest of the year.
Consequently, traders expect rallies and selloffs to reverse instead of leading to trends. They therefore buy as crude oil falls, sell as it rallies, and take quick profits. This creates a trading range.
When will there be a bull trend reversal?
The current 2 month selloff is in search of a bottom. Last week’s big bear breakout was a pair of Bear Surprise Bars. That typically leads to at least a small 2nd leg down. This week met the minimum objective.
Big bars often attract profit takers. Therefore, the bears will probably begin to take profits within a couple of weeks. The bulls know this and they will begin to buy.
The next support is the March 8 low of 55.12. Below that are the February and January higher lows around 52.00.
The buy zone is therefore between this week’s low of 56 and the January low of 51.61. This is an area where bulls will begin to buy and bears will begin to take profits.
What will bottom look like?
The bulls have to stop the selling before they can get a 2 – 3 week rally. There is no sign of a bottom yet.
However, the selling should slow over the next few weeks. Traders will look for a good buy signal bar, especially if there is a micro double bottom. They will then begin to buy, expecting a rally up to resistance.
The 1st target is the top of the most recent sell climax, which his Wednesday’s high of 59.70. That is about $60. That usually corresponds to the 20 day EMA.
EURUSD weekly Forex chart:
Yearlong bear channel, month-long tight trading range
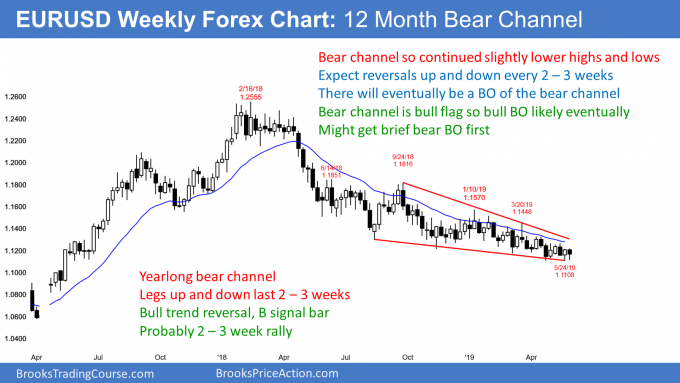
The EURUSD weekly Forex chart has been forming lower highs and lows for a year. This is a bear channel and there is no sign that it is about to end. Consequently, traders continue to buy reversals up from every new low and sell reversals down from rallies to above the 20 day EMA. The legs up and down have lasted 2 – 3 weeks.
The daily chart has been in a tight trading range for a month. Every trading range has both buy and sell setups. The bears have a double top with the May 1 and May 13 highs. The bulls have a double bottom with the April 26 and May 23 low.
Because the chart is now near the 52 week low, traders are expecting a reversal up. The reversal can come from above or below the May 23 low. But, a 2 – 3 week reversal up is more likely that a strong break below the May low.
Possible sell climax below yearlong bear channel
When a bear channel lasts a long time, it often ends with a sell climax. There can be a strong break below the bear channel. But, 75% of the time, a bear break below a bear channel reverses up within 5 bars.
Five bars, but on what time frame? It is the highest time frame that shows the channel. That is the weekly chart.
If traders see a strong selloff over the next few weeks that breaks strongly below the 52 week low and the bear channel, they should be ready for a reversal up. If there is a reversal up, it usually leads to a swing up. The minimum goal would be 10 bars and two legs. It could last longer and go much higher.
Since the weekly chart is in a Spike and Channel bear trend, traders will expect a reversal up to test the start of the bear channel. That is the June 14, 2018 high of 1.1851. Since that is far above, any rally would take many months to get there.
Bear channels usually evolve into trading ranges. Therefore, even if the bulls get a strong reversal up, it will probably be a bull leg in a trading range that will last a year or more.
Monthly S&P500 Emini futures chart:
Double top, but minor reversal
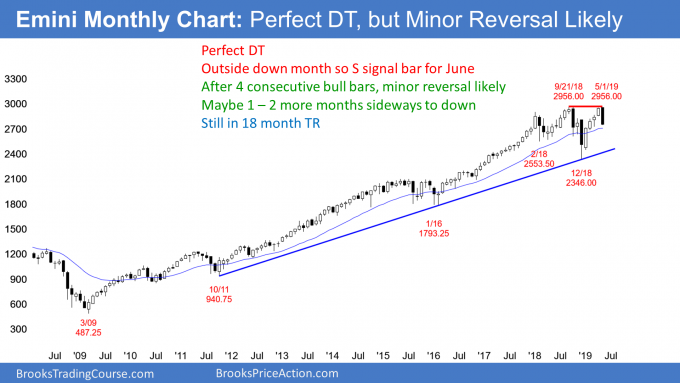
The monthly S&P500 Emini futures chart in May reversed down from above the April high and closed below the April low. May is therefore an outside down month. Furthermore, it formed a double top with the September all-time high. May’s candlestick is now a sell signal bar for that double top.
When there is a double top, the 2nd leg up is often very strong. The January to April rally is an example. Yet, if there is a bear sell signal bar like there is in May, the next bar triggers the sell signal if it trades below the sell signal bar low. Therefore, if June trades below the May low, it will trigger the sell signal for the double top.
In 60% of the instances, the market continues in its trading range. This is true even if it breaks below the neck line of the double top. That is the December low. The breakout usually fails and the trading range continues.
However, there is a 40% chance that the break below the May low will lead to a swing down. It could fall well below the middle of the 18 month trading range and even test the December low.
While it might be difficult to imagine at the moment, the sell signal would give the Emini a 30% chance of breaking far below the December low and falling for about a measured move down. That would be a test of the 2014 – 2015 trading range at around 2,000.
Pullback more likely than trend reversal
Currently, a 2 – 3 month pullback is likely. That is a minor reversal. The odds still favor a new all-time high this year.
However, this 18 month trading range is coming late in a bull trend on the monthly chart. It is therefore a good candidate for the Final Bull Flag. Therefore, if the bulls get a break above the double top, it will probably be the final rally in the 10 year bull trend.
Upcoming trading range will last many years
The Emini will probably correct down to the 2014 – 2015 trading range at some point in the next several years. At that point, it will probably enter a big trading range that could last for a decade.
Trading ranges typically follow big bull trends. Since this is the monthly chart, the trading range can last many years. That happened from 1965 – 1982 and again from 1997 – 2012. During those trading ranges, there were several selloffs of 30 – 50% and many rallies of 50 – 100%. Traders should expect this to begin again at some point in the next few years.
Weekly S&P500 Emini futures chart:
Emini selling off to March 2726 low and maybe 10% correction
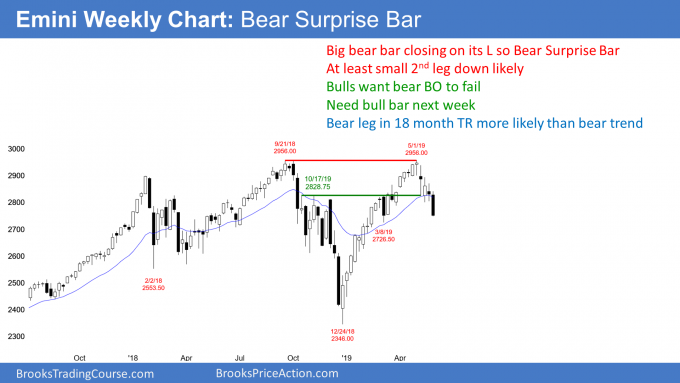
The weekly S&P500 Emini futures chart triggered a sell signal when this week traded below last week’s low. However, last week was a doji bar. That is a weak sell signal bar. Furthermore, the past 4 weeks all had prominent tails. That is not how a bear trend typically begins. That lack of momentum and the weak sell signal bar make a protracted, deep selloff unlikely.
This week was the entry bar for the sell signal. Because it was a bear bar closing below last week’s low, there is an increased chance of lower prices over the next few weeks.
However, each bar for the past 4 weeks had a high below the high of the prior bar. This is a 5 bar bear micro channel. The bears hope it is an early bear trend. But the prominent tails on the bars represents a lack of conviction on the part of the sellers. Consequently, the micro channel will probably end within the next few weeks. That means that the high of a bar will be above the high of the prior bar.
1st reversal up from bear micro channel will be minor
It is important to realize that the 1st reversal up in a 5 bar bear micro channel is typically minor. Traders will expect a 1 – 3 week rally and then a test back down. This limits the upside for the next several weeks.
The lack of consecutive big bear bars closing near their lows limits the downside.
What’s left? A trading range. This selloff is probably a bear leg in a developing trading range.
Disappointment and confusion are hallmarks of a trading range
Traders know that trading ranges can last longer and fall further than what seems reasonable. Trading ranges typically disappoint bulls and bears by forming breakouts that reverse instead of continuing into a trend.
Also, the lack of clarity confuses traders. The probability of everything is less than in a trend. Reversals often do not have strong signal bars. Legs up and down typically continue further than what seems likely. Breakouts of prior swing highs and lows reverse.
There is only one thing that traders see as high probability. Reversals are more common than breakouts. Consequently, they buy low and buy more lower. They are betting against a bear trend. Also, the sell high and sell more higher, betting against a bull trend. Finally, since they expect reversals, they are quick to take profits.
The result of traders buying low, selling high, and taking quick profits is a trading range. The weekly chart is in the early stages of a trading range. There is no sign that it is about to end.
Daily S&P500 Emini futures chart:
Break below neck line of head and shoulders top
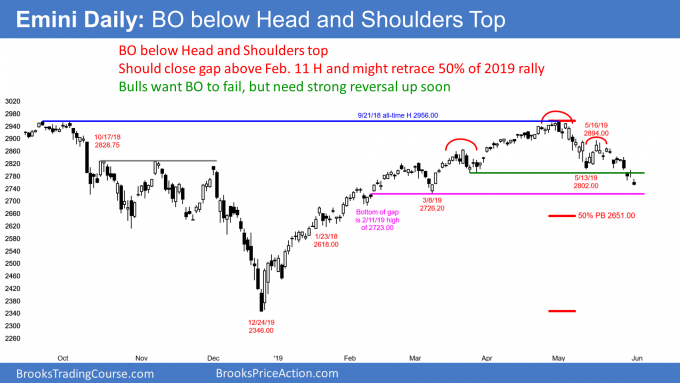
The daily S&P500 Emini futures chart this week broke below the bottom of the 3 month trading range. It also broke below the 2800 Big Round Number. The trading range was a head and shoulders top, which is always a lower high major trend reversal. This week triggered the major trend reversal sell signal by breaking below the neck line of the head and shoulders top.
It is important to realize that a major trend reversal sell signal only becomes a major trend reversal 40% of the time. More often, the breakout soon reverses back up and the trading range continues or the bull trend resumes.
Support around 2650
There is no credible sign of a reversal up yet. Furthermore, there are important magnets below. The first is the gap above the February 11 high of 2723.00. Next, a 10% correction is that at 2660.40. Finally, a 50% retracement of the 2019 rally is just below at 2651.00.
Many bulls would be more confident that the selloff is over if it continues down to just below those targets and then reverses up. If it reverses up before then, the bulls will feel that the Emini had not tested important support. This will make them hesitant to buy as the Emini rallies. That relative lack of buyers could then lead to a lower high and a test of that important support.
Will the selloff end soon?
Can the Emini rally up to a new high from where it is now? That is unlikely. The selloff has been in a tight bear channel. The 1st reversal up from a tight bear channel is typically minor. Traders will want to see a test down and then a 2nd reversal up before they will believe that the bull trend is resuming.
Less often, a minor reversal can continue up and become major. The bulls would need to see several big bull bars closing near their highs before they would be confident that the selloff has ended.
In the meantime, traders believe that the selloff is a pullback in a bull trend and not the start of a bear trend. However, there is no credible bottom and there are targets below. This uncertainty will probably lead to a trading range over the next several weeks. It could last many more months.
The most recent leg down has lasted about 2 weeks. That is similar to the 1st leg down to the May 13 low. That increases the chance of a bounce for several days this coming week.
Trading Room
Traders can see the end of the day bar-by-bar price action report by signing up for free at BrooksPriceAction.com. I talk about the detailed Emini price action real-time throughout the day in the BrooksPriceAction.com trading room. We offer a 2 day free trial.
Charts use Pacific Standard Time
When I mention time, it is USA Pacific Standard Time (the Emini day session opens at 6:30 am PST, and closes at 1:15 pm PST). You can read background information on the intraday market reports on the Intraday Market Update page.
Thanks Al, I aways look forward to your end of week blog.
On Friday the bonds and notes looked like a buy climax after three pushes up… or a measuring gap.
Yes, I agree, and it is testing the lower high, but there is no reversal yet. I wrote a few times over the past 2 years that the 30 year bond market is putting in a generational high. This rally is a test of the lower high. It might test the actual all-time high as well. In either case, the trend will probably be down for the next 20 years. As strong as this rally is, it will likely be a bear rally in a 20 year bear trend. That means interest rates will go up for the next 20 years, even if the old trend has not yet quite exhausted itself. Trend change is often a process where the new trend begins before the old one ends, and the old one continues for a while, after the new one begins.