Trading Update: Wednesday September 21, 2022
Emini pre-open market analysis
Emini daily chart
- The market is beginning to stall just under the September 6 breakout point and will probably have to bounce with upside breakout test of the 4,000 big round number soon.
- There is the Emini FOMC report today at 11:00 PT which has the potential to lead to a big move up or down.
- It is possible that the FOMC report is the catalyst that leads to a sharp upside breakout; however more likely, that today’s FOMC report will lead to sideways trading.
- While the bears see the market in a bear channel and want to continue lower, the channel is developing too much buying pressure. This means the odds favor a bounce and sideways to up soon.
- Bulls see a wedge bottom (8/24, 9/6); they want two legs up and a test of the 4,000 big round number.
- The bulls developed strong buying pressure during the rally up to September 12. This increases the odds that the breakout below September 6 will lead to a trading range instead of a measured move down.
- The bulls ultimately see this selloff as a developing head and shoulders bottom, which is always a higher low major trend reversal. They want a strong upside breakout that eventually reaches the August 16 breakout point. However, that is not likely over the next couple of months.
- Overall, traders should expect sideways up over the next couple of weeks and continued trading range price action.
Emini 5-minute chart and what to expect today
- Emini is up 15 points in the overnight Globex session.
- The market has been in a broad trading range for most of the Globex session and is currently rallying in a bull leg in what will likely be a trading range.
- Traders should expect a trading range day going into the FOMC report today.
- Traders should be flat for at least an hour going into the report.
- When the report is released, wait until the close after the FOMC report bar before placing a trade; too often the second bar following the FOMC will reverse the market.
- In general, traders should trade a fourth of their normal position size during the FOMC report so they can ensure they are trading small enough.
- As always, most traders should wait for the first 6-12 bars on the open before placing a trade. Today has the potential to have more trading range price action on the open than usual going into the FOMC report at 11:00 PT today.
- Traders can also consider waiting for a credible stop entry such as a wedge bottom/top, or a double bottom/top.
- The most important thing is to be patient today. The FOMC report often presents great movement so if one can trade small and is confident in their ability to read the chart, one is better off saving their energy for the report.
- While the FOMC report has the potential to lead to a big move up or down, more likely, the report will disappoint traders and lead to trading range price action.
Yesterday’s Emini setups

Brad created the SP500 Emini charts.
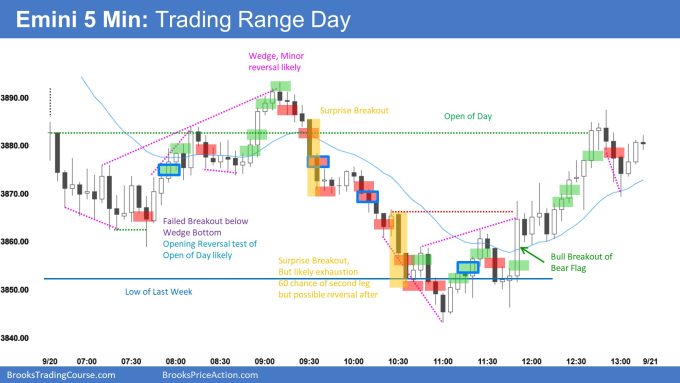
Here are several reasonable stop entry setups from yesterday. I show each buy entry with a green rectangle and each sell entry with a red rectangle. Buyers of both the Brooks Trading Course and Encyclopedia of Chart Patterns have access to a much more detailed explanation of the swing trades for each day (see Online Course/BTC Daily Setups).
My goal with these charts is to present an Always In perspective. If a trader was trying to be Always In or nearly Always In a position all day, and he was not currently in the market, these entries would be logical times for him to enter. These therefore are swing entries.
It is important to understand that most swing setups do not lead to swing trades. As soon as traders are disappointed, many exit. Those who exit prefer to get out with a small profit (scalp), but often have to exit with a small loss.
If the risk is too big for your account, you should wait for trades with less risk or trade an alternative market like the Micro Emini.
EURUSD Forex market trading strategies
EURUSD Forex daily chart

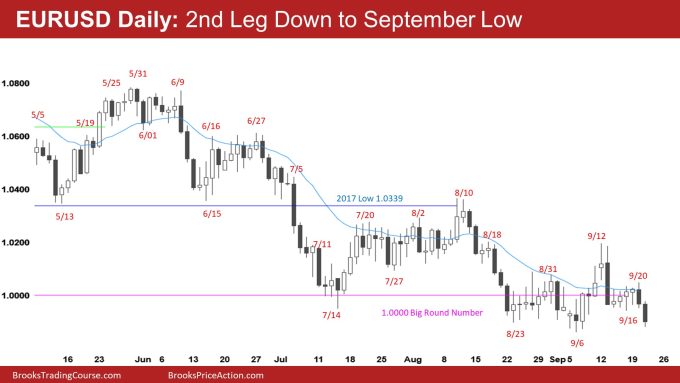
- The bears are getting their second leg down testing the September low.
- The market will probably disappoint bears before the day closes.
- The bulls want today to reverse up on the FOMC report and create a second entry buy.
- The bulls see today as a higher lower major trend reversal and a truncated wedge bottom with August 23, and September 6.
- As strong as the bears look here, the market is in a trading range and the bulls are getting a lot of consecutive bull trend bars which increases the odds of a reversal up.
- The bears are hopeful that they can get a breakout below the September 6 low and measured move down, however the odds are against it.
- Ultimately, the EURUSD will likely rally soon and reach the August high.
Summary of today’s S&P Emini futures price action and what to expect tomorrow

Brad created the SP500 Emini charts.
End of day review
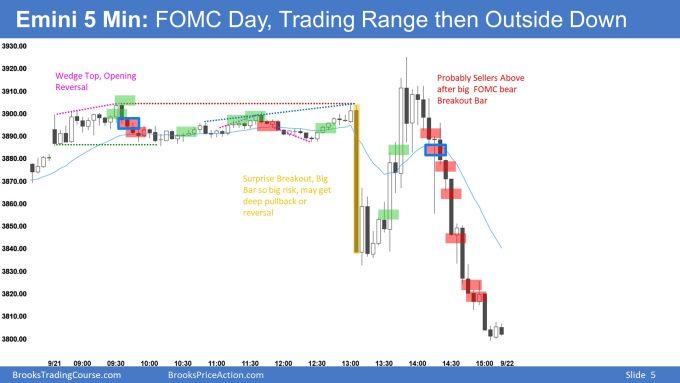
- Today led to a trading range going into the FOMC report at 1:00 Central Time.
- The bears got a big bear breakout bar on the FOMC report. However, the bar was too big, which increased the odds of sideways and a possible reversal back up.
- The bulls rallied above the day’s high during the 13:45 bull breakout; however, it was the third push-up and a parabolic wedge, which increased the odds of a reversal. Also, the size of the FOMC 13:05 bar increases the odds of there being more sellers above the bar than buyers.
- The bears ultimately got their second leg down following the 13:05 bar at the end of the day.
- Overall, today was a good day for the bears, and the market managed to close near its low.
- While the bears hope today’s breakout below the July 18th low will be successful and lead to a test of the day’s low, more likely there will be buyers not far below, and the market will reverse up.
See the weekly update for a discussion of the price action on the weekly chart and for what to expect going into next week.
Trading Room
Traders can see the end of the day bar-by-bar price action report by signing up for free at BrooksPriceAction.com. Al talks about the detailed S&P Emini futures price action real-time throughout the day in the BrooksPriceAction.com on trading room days. We offer a 2 day free trial.
Charts use Pacific Time
When times are mentioned, it is USA Pacific Time. The Emini day session charts begin at 6:30 am PT and end at 1:15 pm PT which is 15 minutes after the NYSE closes. You can read background information on the market reports on the Market Update page.