Monthly S&P500 Emini futures candlestick chart: Swing traders are still long
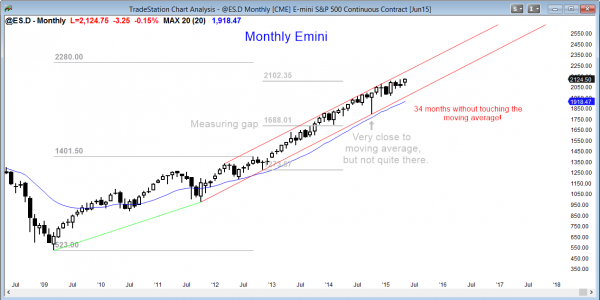
The monthly S&P500 Emini futures candlestick chart is overbought, but the tight channel bull trend has no sign of a top yet.
The monthly S&P500 Emini futures candlestick chart is continuing its small pullback bull trend, but it is very overbought. There is a high probability that it will correct 10% at some point this year, and a reasonable chance that it will also test the October low. However, traders learning how to trade the market have to accept that there is no top yet, and the Emini could go much higher before that 10% selloff begins. The best price action strategy is to be prepared for a reversal down at any time in the next few months because once it is underway, it can offer great swing trades for bears, but they might be brief.
Weekly S&P500 Emini futures candlestick chart: Not high probability trading for bull breakout swing traders
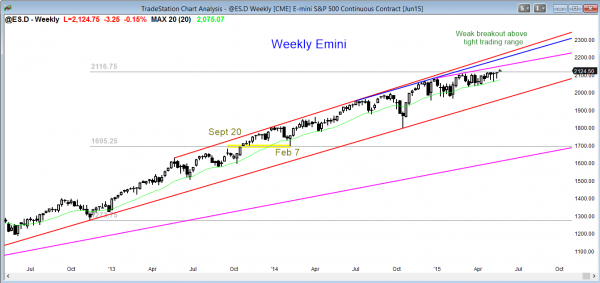
The weekly S&P500 Emini futures candlestick chart has had a 5 week breakout that has been small, which increases the chances that it will fail and the Emini will reverse down soon.
The weekly S&P500 Emini futures candlestick chart has been breaking above a 3 month tight trading range for the past 5 weeks, but the breakout has been small and the follow-through has been terrible. This increases the chances that it will fail. However, without a strong sell candlestick pattern or a strong bear breakout, the best swing trading strategy is to continue to look for buy setups.
Daily S&P500 Emini futures candlestick chart: Day trading tip for Monday is to trade the breakout of the ioii setup
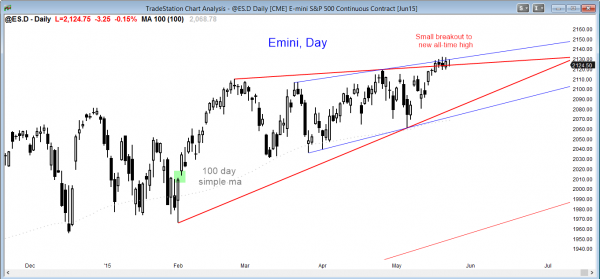
The daily S&P500 Emini futures candlestick chart is in an ioii breakout mode setup.
The daily S&P500 Emini futures candlestick chart is having a weak breakout to a new all-time high, and has been in a 4 day tight trading range that is also an ioii breakout mode setup. Because today was a doji bar, it is a low probability sell setup for Monday, even though the Emini is very overbought on all time frames. The high probability trading only comes if the Emini develops a strong sell candlestick pattern or has a strong breakout up or down with strong follow-through. Until then, the weak broad bull channel and trading range of the past 6 months will continue. The height of the channel is big enough for bears to sell reversals down, and as long as the Emini remains in a bull channel, bulls will continue to buy pullbacks.
Best Forex trading strategies
The EURUSD has been in a bear rally in the weekly chart and it turned down from a 20 gap bar setup (the rally was the first test of the moving average in over 20 bars). Although traders learning how to trade the markets see the wedge top that developed in May and might assume that the EURUSD would find support at the bottom of the wedge, today broke strong below. The bulls hope that this bear breakout will fail. The bears believe it is strong enough to have follow-through selling and some kind of a measured move down. The bear case currently has higher probability because of the size of today’s bear breakout below the month long trading range, and because of the break below the top of the March trading range. Traders learning how to trader Forex markets should look to sell a pullback for a 2nd leg down.
Traders can see the end of the day bar-by-bar price action report by signing up for free at BrooksPriceAction.com. I talk about the detailed Emini price action real-time throughout the day in the BrooksPriceAction.com trading room, and a 2 day free trial is available.
When I mention time, it is USA Pacific Standard Time (the Emini day session opens at 6:30 am PST, and closes at 1:15 pm PST). You can read background information on the intraday market reports on the Intraday Market Update page.


