Market Overview: EURUSD Forex
The EURUSD bulls need a breakout above the January 27 high with follow-through buying trading far above the bear trend line and the 20-week EMA to increase the odds of the bull leg beginning. The bears ope the 20-week EMA and the bear trend line will act as resistance.
EURUSD Forex market
The Weekly EURUSD chart
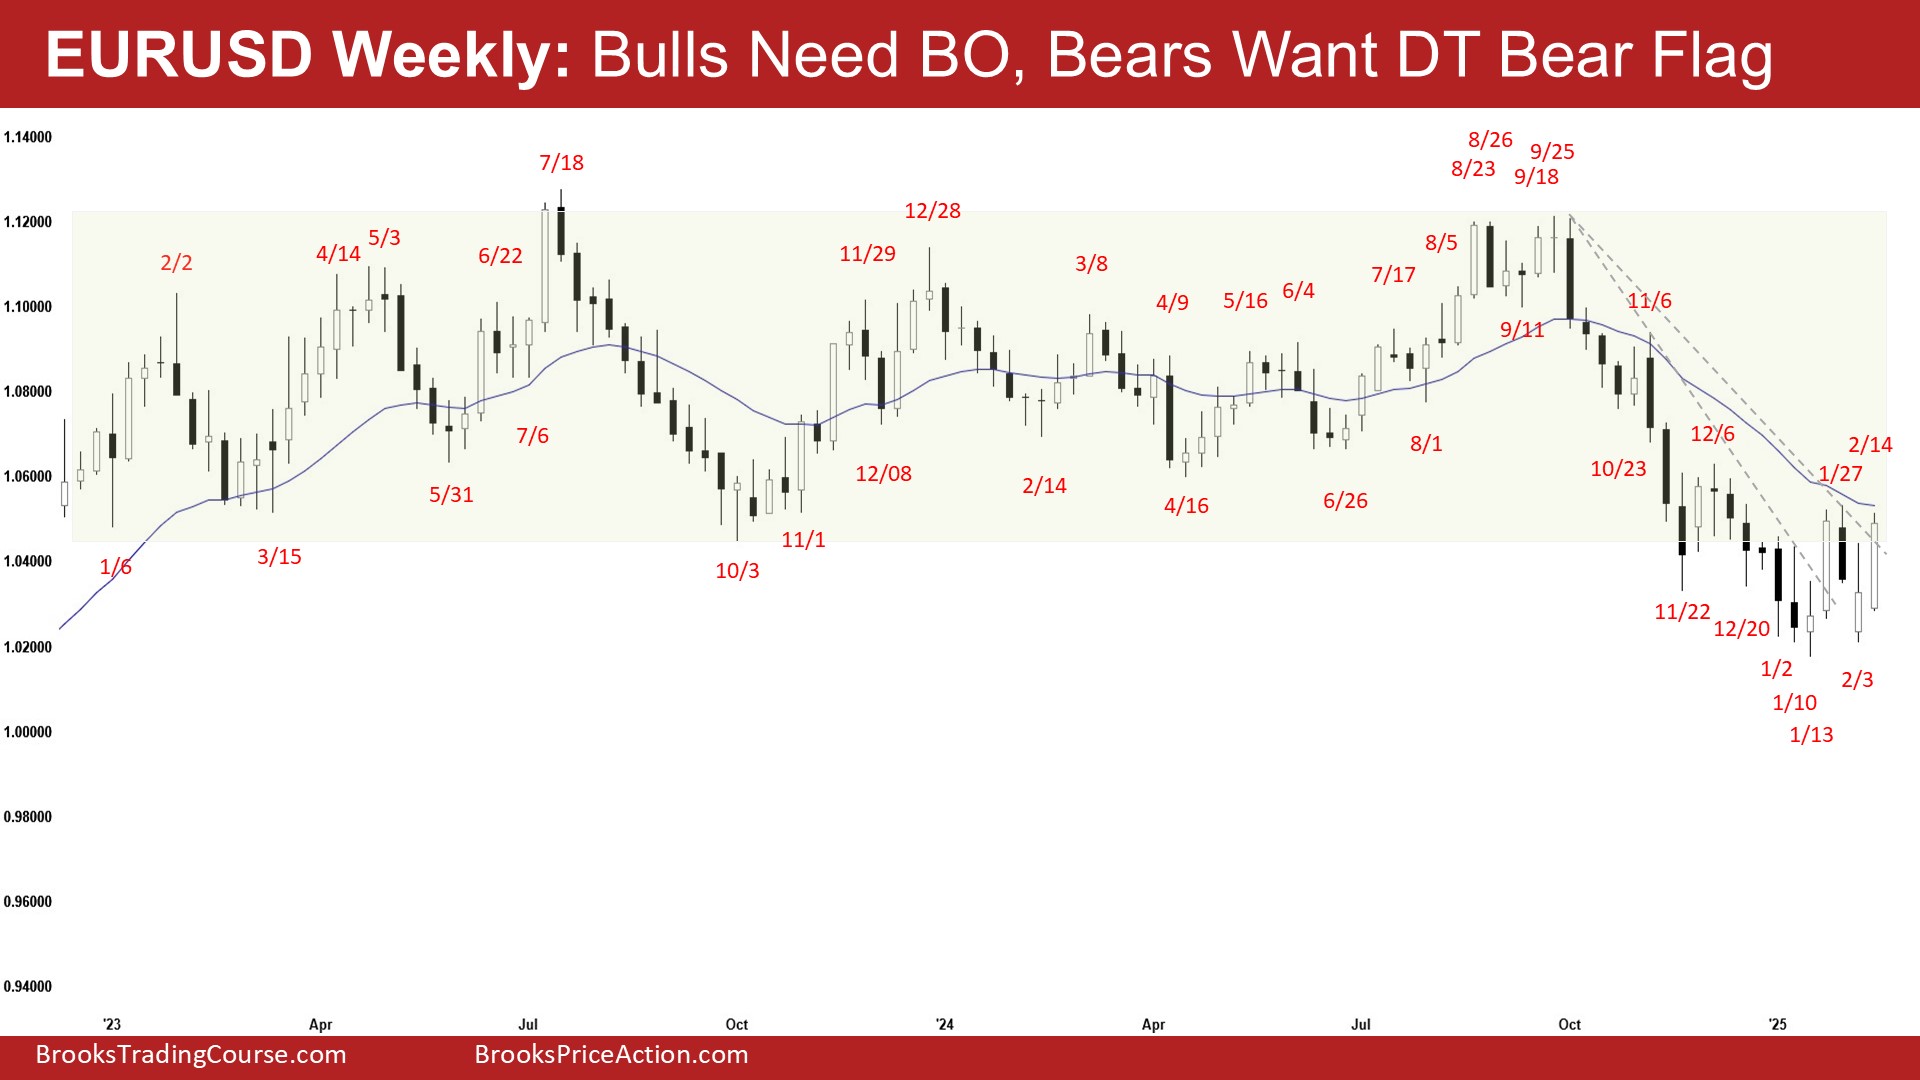
- This week’s candlestick on the weekly EURUSD Forex chart was a big bull bar closing near its high with a small tail above.
- Last week, we said that traders would see if the bulls could create more follow-through buying, breaking above the bear trend line and the 20-week EMA or if the bears could create a retest and breakout below the January 13 low instead.
- The bulls got a strong follow-through bull bar this week.
- They see the whole move down (from Sept) as a sell vacuum and a bear leg within a trading range.
- They see the recent move (Feb 3) as a retest of the prior trend’s extreme low and want a higher low major trend reversal.
- They want a failed breakout (below the trading range) followed by a retest of the middle of the trading range (near the Nov 6 high area).
- They must create a breakout above the January 27 high with follow-through buying trading far above the bear trend line and the 20-week EMA to increase the odds of the bull leg beginning.
- The bears see the current move as a pullback.
- They want a reversal from a double top bear flag (Jan 27 and Feb 14), or a wedge bear flag (Dec 6, Jan 27 and Feb 14) followed by a retest of the January 13 low.
- They hope the 20-week EMA and the bear trend line will act as resistance.
- They want a strong breakout (below the trading range), and a measured move based on the height of the trading range.
- The problem with the bear’s case is that the breakout and follow-through selling below the trading range has been limited.
- They need to create strong consecutive bear bars closing near their lows to increase the odds of a successful breakout.
- So far, the market has traded sideways in the last 9-weeks.
- Since this week’s candlestick is a big bull bar closing near its high, it can be a buy signal bar for next week.
- The market may still trade at least a little higher.
- For now, traders will see if the bulls can create more follow-through buying trading far above the bear trend line and the 20-week EMA.
- Or will the market trade slightly higher but stall around the 20-week EMA or the December 6 high areas?
- Most breakouts from trading ranges fail and odds favor the trading range to continue.
- If the retest of the January 13 low is weak (overlapping candlesticks, doji(s), bull bars with long tails below), the odds of a higher low major trend reversal followed by another sideways to up leg will increase. So far, this appears to be the case.
The Daily EURUSD chart
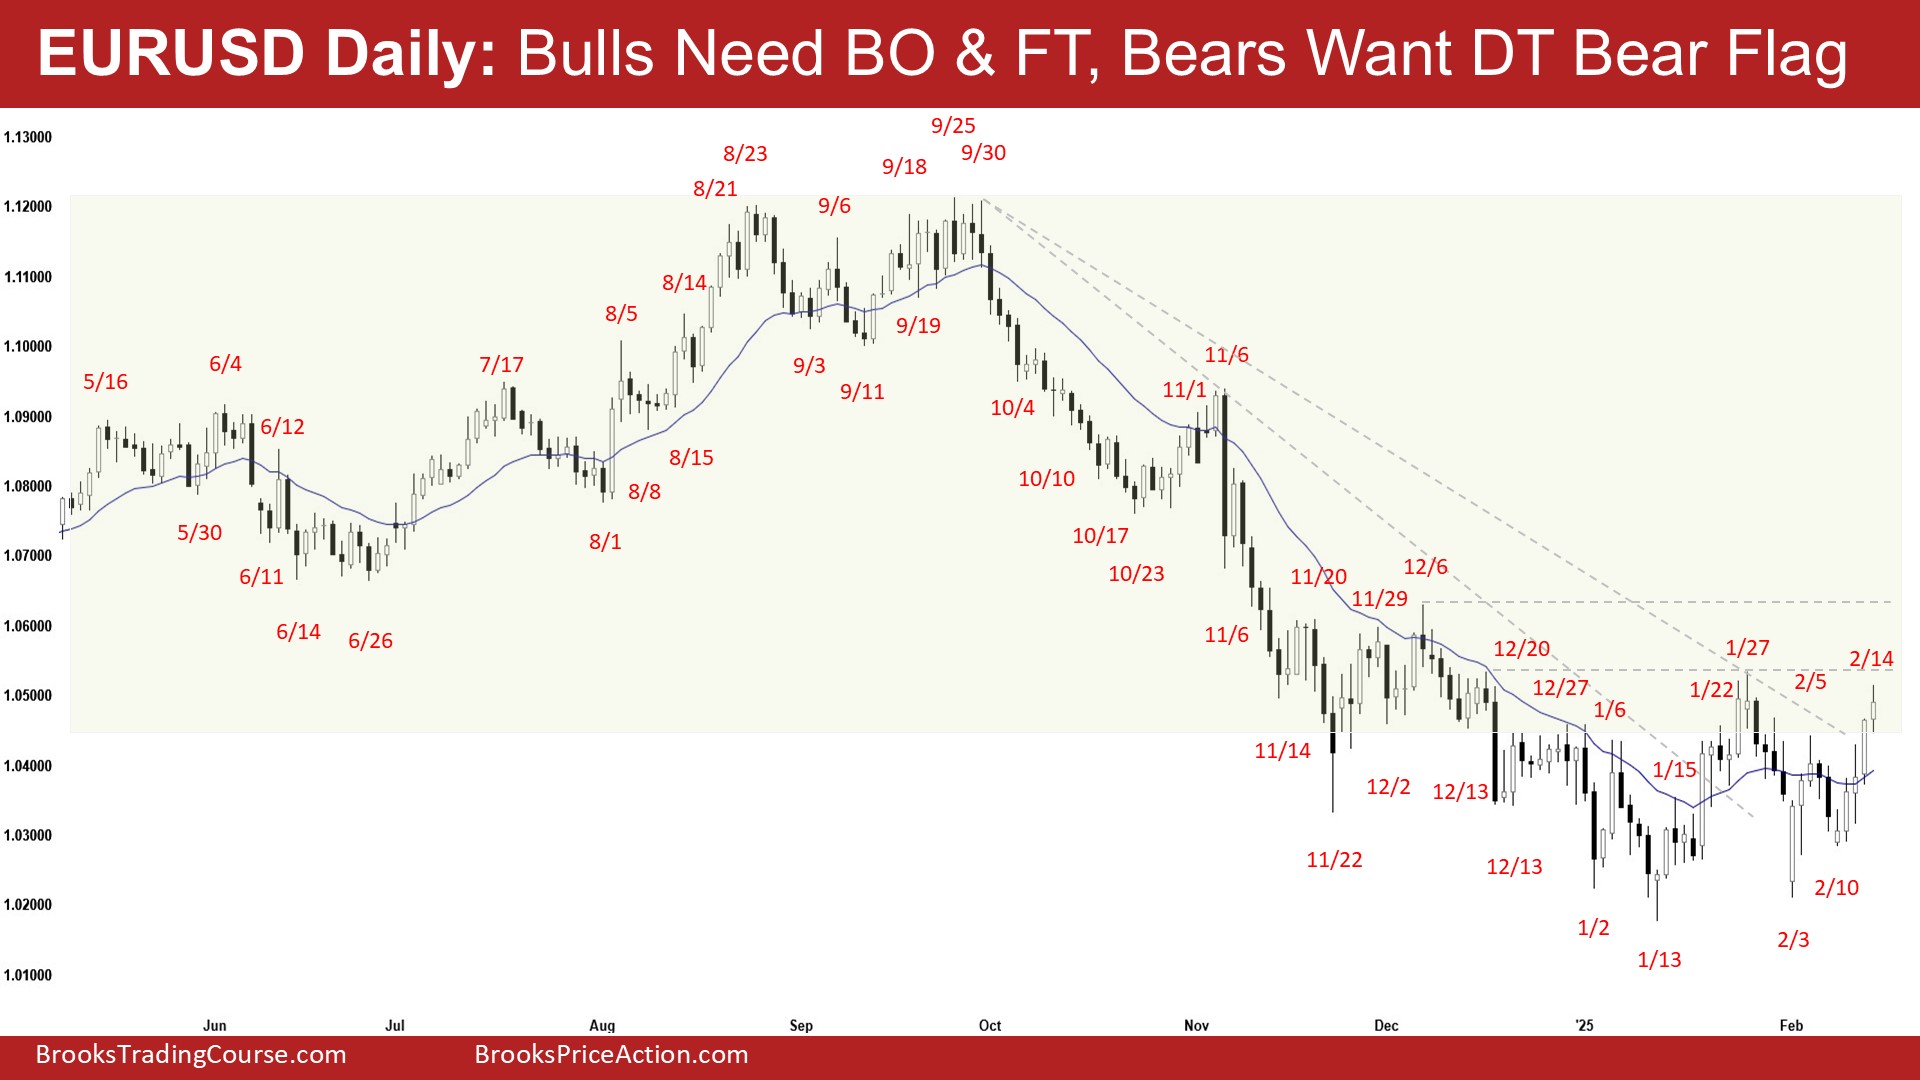
- The EURUSD opened slightly lower on Monday and traded sideways to up for the rest of the week.
- Last week, we said that traders would see if the bulls could create more follow-through buying, breaking far above the bear trend line and the 20-day EMA or if the market would retest the January 13 low followed by a breakout attempt instead.
- The bulls created follow-through buying testing near the January 27 high area.
- They see the whole move since September as a sell vacuum and a bear leg testing the trading range low.
- They want a failed breakout and a reversal from a wedge pattern (Oct 23, Nov 22, and Jan 13), an embedded wedge (Dec 13, Jan 2, and Jan 13) and a higher low major trend reversal.
- They want a breakout above the January 27 high followed by a measured move based on the height of the 9-week trading range.
- They must create follow-through buying trading far above the January 27 and December 6 highs to increase the odds of the bull leg beginning.
- If the market trades lower, they want the 20-day EMA to act as support.
- The bears see the current move as a pullback and want a reversal from a double top bear flag (Jan 27 and Feb 14).
- They hope that the January 27 or December 6 highs area will act as resistance.
- They hope to get a retest of the January 13 low followed by a breakout below.
- The problem with the bear’s case is that the follow-through selling following the breakout below the trading range has been limited.
- They need to create strong consecutive bear bars to show that they are back in control.
- So far, the market has traded sideways in the last 9-weeks.
- The buying pressure since the January 13 low is slightly stronger (consecutive bull bars, bigger bull bars) compared to the weaker selling pressure (bear bars with limited follow-through selling).
- For now, traders will see if the bulls can create a breakout above the January 27 high with sustained follow-through buying.
- Or will the market trade slightly higher but stall around the January 27 or December 6 high area?
- Most breakouts from trading ranges fail and odds favor the trading range to continue.
Market analysis reports archive
You can access all weekend reports on the Market Analysis page.


These Eur/Usd reports are so helpful for forex traders. Thank you!
Dear Steven, thanks for going through the report..
Wishing you a great week ahead!
Best regards,
Andrew