Market Overview: FTSE 100 Futures
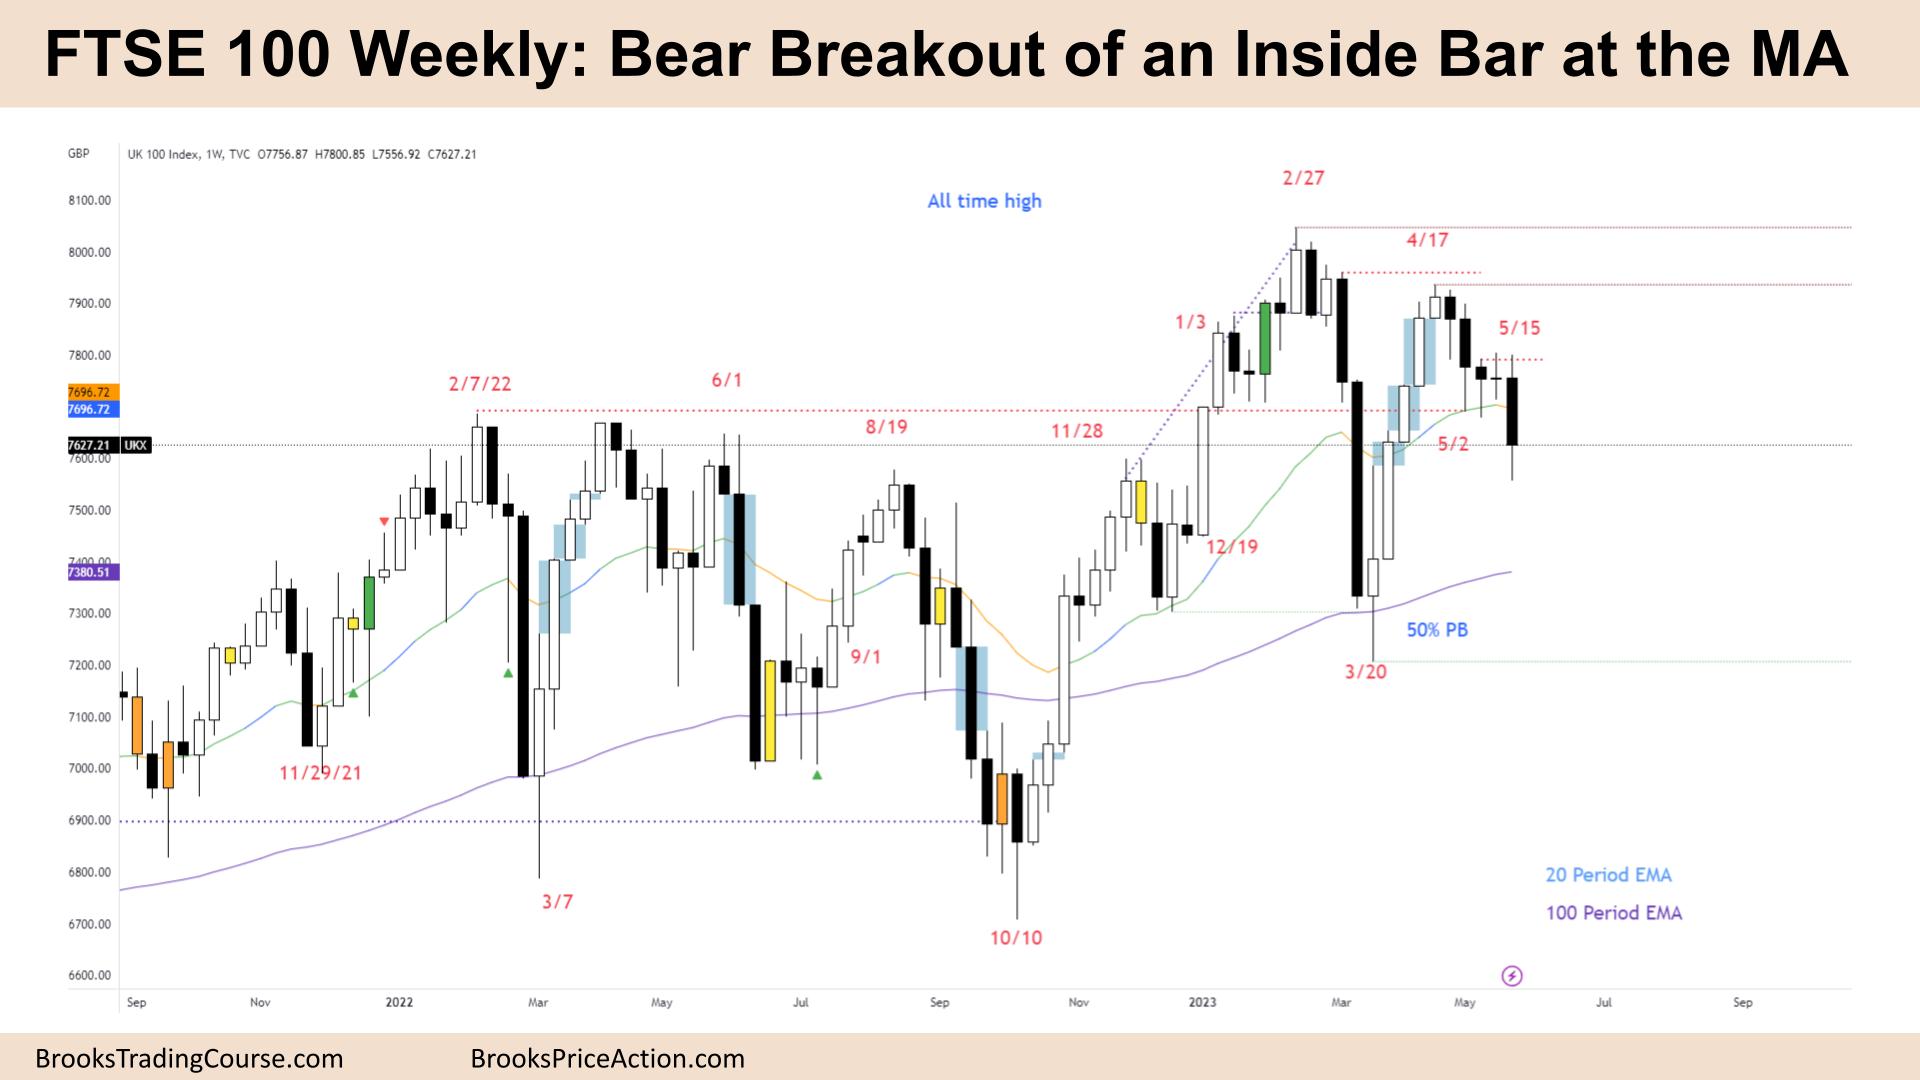
The FTSE futures market moved down last week with a FTSE 100 big bear breakout of an inside bar. We are at a 50% pullback of the prior bull leg sitting on the moving average (MA) and at the prior high of the 18-month trading range. We might need to go sideways here while traders decide on the next move. It is a sell signal for next week, but it is lower down in the range. And it is a big bull bar, so not a great buy either.
FTSE 100 Futures
The Weekly FTSE chart

- The FTSE 100 futures was a bear breakout, a big bear bar closing below its midpoint with tails above and below.
- It is the 5th consecutive bear bar and the second leg.
- We broke strongly below last week’s bear bar, so we are likely always in short. Most traders should be short or flat.
- We just closed an open bull gap from March with the tail but did not close the body gap.
- Gaps closing are a sign of trading range price action or the end of a trend.
- The bulls see an 18-month trading range breakout, a higher high, and a deep pullback to 50% of that leg. They see it as a lower high and this second leg having two legs.
- The leg up from March was strong enough to expect a second leg, but it hasn’t started yet.
- But 5 bear bars are disappointing, so we can expect sellers above at the April high and maybe even beforehand.
- Bulls will scale in above the next bull bar and likely get out at the midpoint of the two entries or the Low 1 on April 17th.
- The bears see a failed breakout above the trading range and now a lower high. It is possibly a head and shoulders top, and we just printed the right shoulder.
- An Head & Shoulders top (HST) is also a Lower High Major Trend Reversal (LH MTR). Traders will expect two legs sideways to down if that is the case. We are likely in the second leg.
- Most of the bar is below the moving average, so likely sellers are above.
- Bulls want a bull bar next week to buy above, a High 2 and a reasonable long swing entry at the MA in a bull trend.
- Because this bar is larger than the others, it is a type of climax, and some traders will expect profit-taking. Bears need follow-through, a measured move down from the lower high.
- The prior week was a doji, so a bad sell signal. We might go up early next week to let those trapped traders out before moving down.
- March 20th was a reasonable bar to sell above in a bear spike, and they got trapped, so we expected buying at that high.
- Also, remember the prior week was an inside bar, so breakouts of inside bars have a high failure rate. Likely, we pull back to the low.
- It was reasonable for bulls to buy at the MA, so we should get back there to let them out.
- Expect sideways to down next week, with a pullback of the bear breakout
The Daily FTSE chart

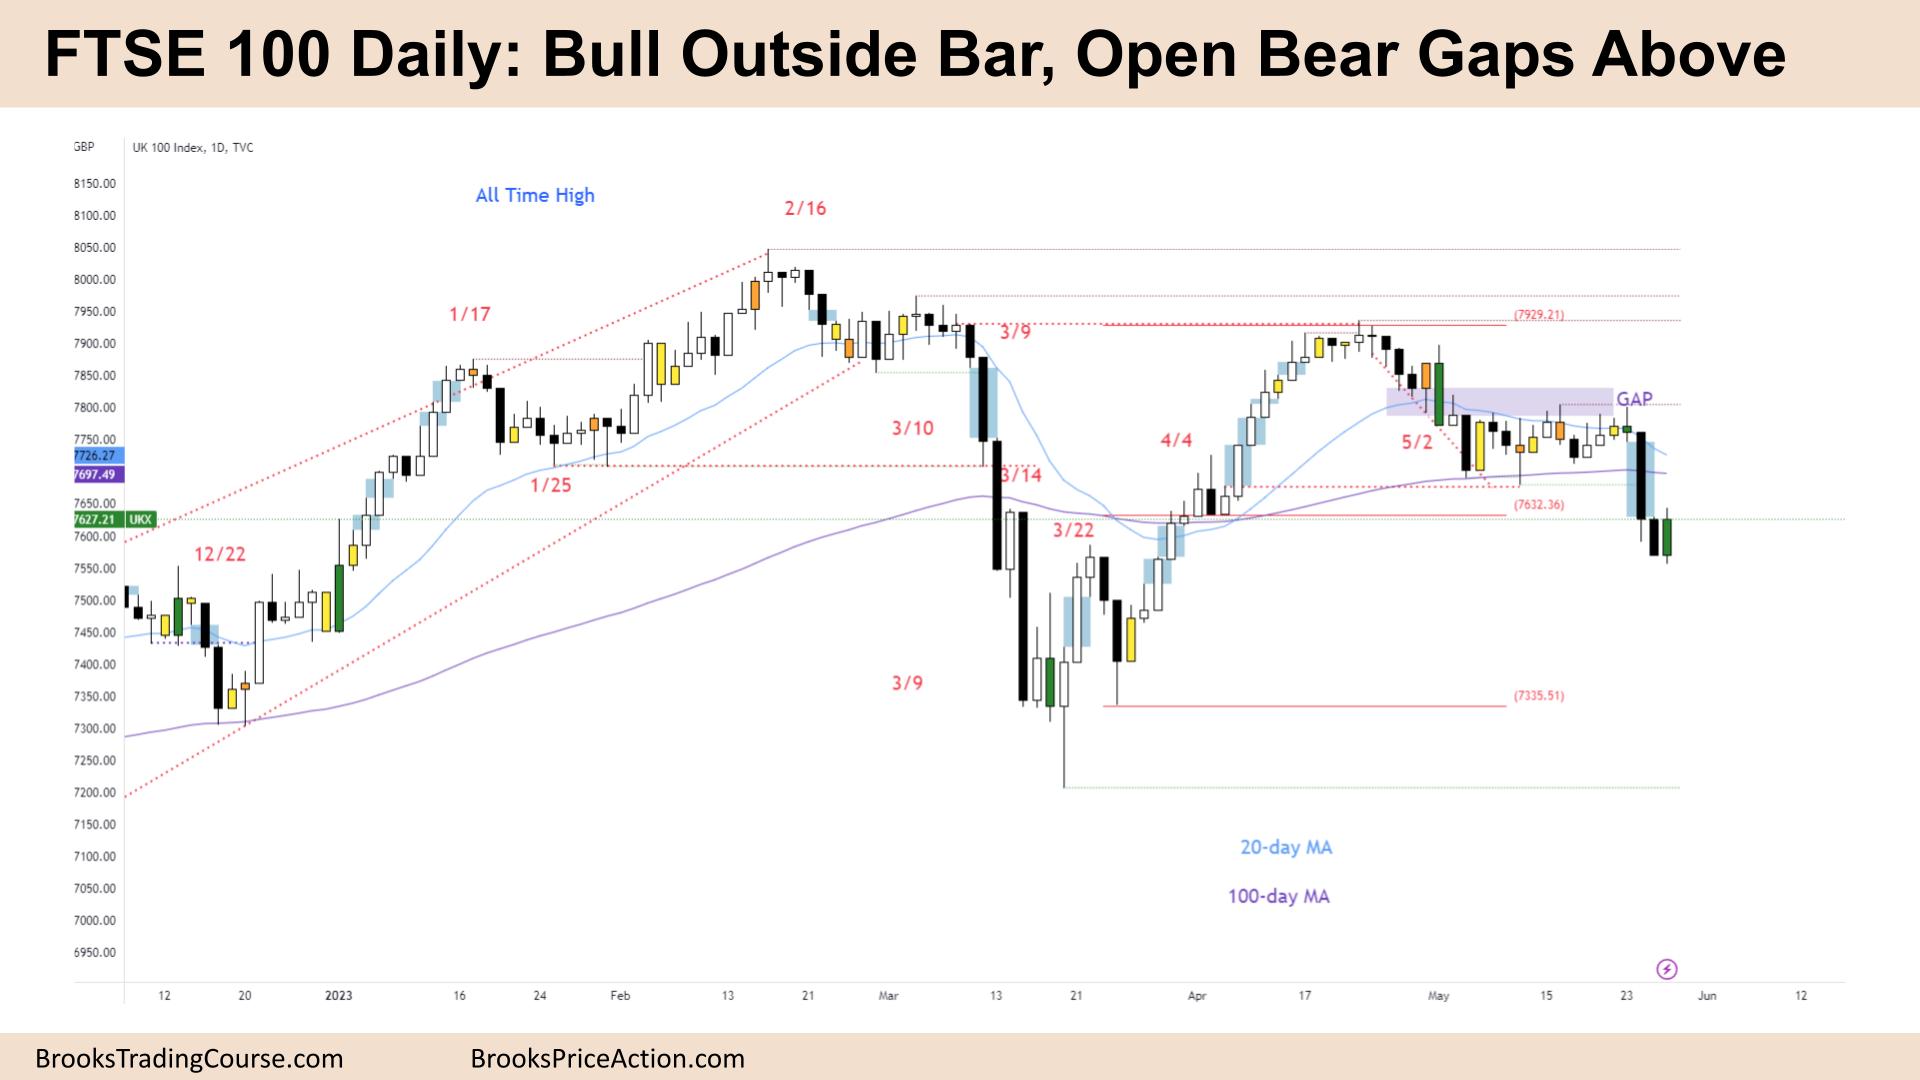
- The FTSE 100 futures was a bull outside bar on Friday which failed to close above Thursday.
- Tuesday was also an outside up bar, but it closed below, so there is resistance underneath that bar.
- Bears will sell the midpoint of Wednesday’s big climax bar and the middle of the open gap. It is a bear breakout on a higher timeframe.
- We expected the market to test the price on March 22nd as it was a double top (DT) bear flag that failed and trapped bears. The bull leg was strong, but it was just a test of the bear BO point above – a lower high.
- We are in the middle of the range, so the probability is likely 50% for either direction and we will likely enter a limit-order environment next week.
- The bulls see a two-legged pullback after a strong leg up. They want a second leg symmetrical to the first.
- But the pullback has too many bars now. An endless pullback, disappointment and trading range price action.
- The bears see the wedge bottom reversal failed, and we broke below – they want a measured move down – back to the inside bar that set off the initial bull leg.
- Consecutive bear bars close below the MA – so we are likely always in short and STC. Traders will expect a second leg – maybe even two legs down because of the surprising strength.
- The bulls want it to be a sell climax and reversal, maybe a micro DB on the daily chart.
- But the bears have two open gaps now, which might keep us heading down to support.
- Expect sideways to down next week.
Market analysis reports archive
You can access all weekend reports on the Market Analysis page.