Market Overview: FTSE 100 Futures
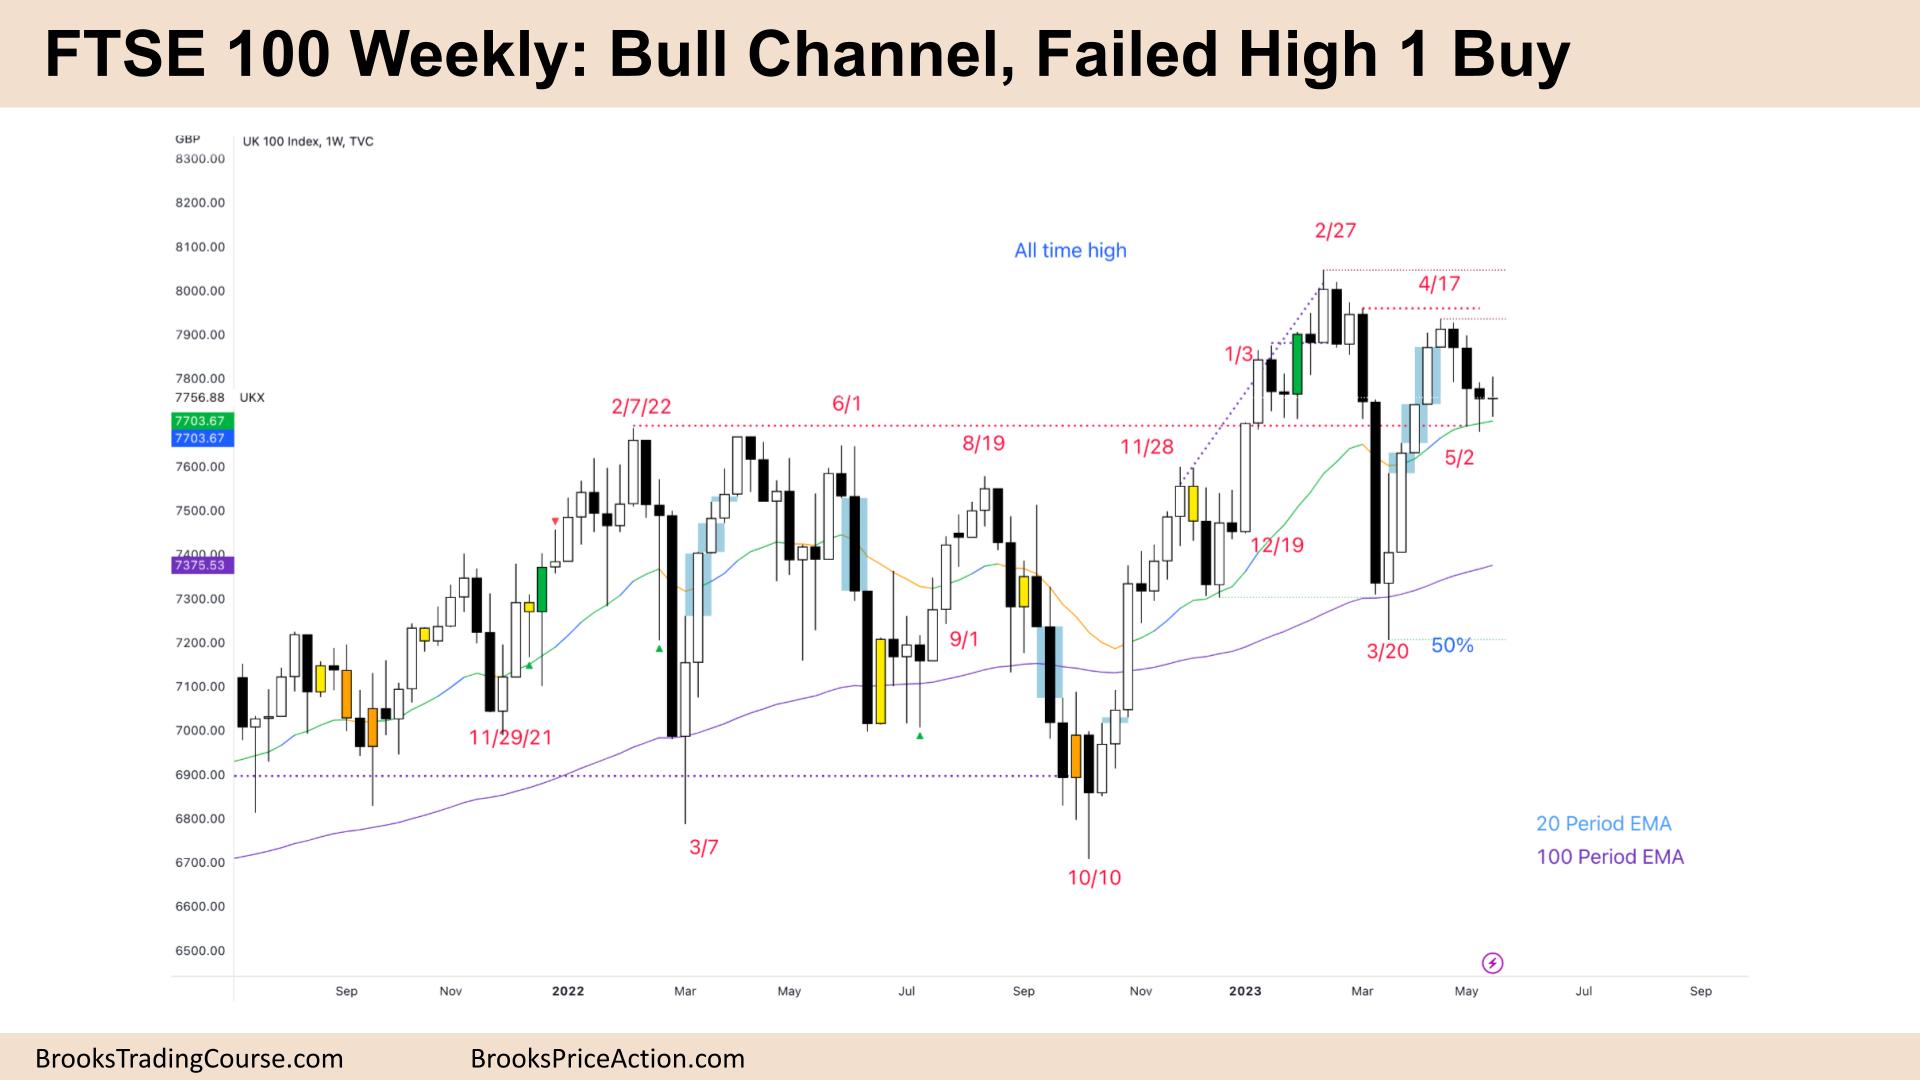
The FTSE futures market moved sideways in the late stage of a broad FTSE 100 bull channel. It was a failed High 1 buy above a bear micro channel, and the bears should get a little more down. The bulls want to get a second leg after a strong move up from the 200-Week MA, but it is a lower high. Next week is important as traders decide if we will get up to the all-time high (ATH) like the DAX market did last week.
FTSE 100 Futures
The Weekly FTSE chart

- The FTSE 100 futures was a small bull doji (2 points!) with tails above and below.
- It traded above the prior bar’s high, so it is a High 1 buy – although the context is a better sell because it follows a 3-bar bear micro channel.
- It’s a doji, so neither a great buy nor a sell. Low in a trading range, there are probably more buyers below.
- The bulls see a bull channel, a micro double bottom (DB), a pause at the moving average (MA) after a strong first leg from the 200-week MA.
- You can see open bull gaps on the chart, and around the midpoint of these gaps was the ideal entry point long.
- But the bears see we are not strongly moving away from it. They see a Lower High Double Top and no tails above the bars.
- The bulls want a good weekly buy signal, a bull bar closing above its midpoint for a reasonable buy signal, and a High 2 at the MA for a test of the high.
- The bears want the High 1 to fail (it might already have) and get another leg sideways to down.
- The last strong event on the chart is the sell-climax in March. This was disappointing for the bulls, and you can see as soon as we got back to the top of the sell-climax, the bulls sold also.
- The bears sold above the doji on March 20th and also got trapped.
- If a second leg gets down there, buyers will be waiting – stuck bears and the bulls looking to get a good entry low in a trading range.
- The bulls know we have only a few bars below the MA, so they can buy and scale in lower as a reasonable trade, better above a good bull bar.
- Bulls bought below the pullback on the bull spike on April 24th, so we also need to get up there to let them out.
- Expect sideways to up next week. The bears want an outside down and a small second leg.
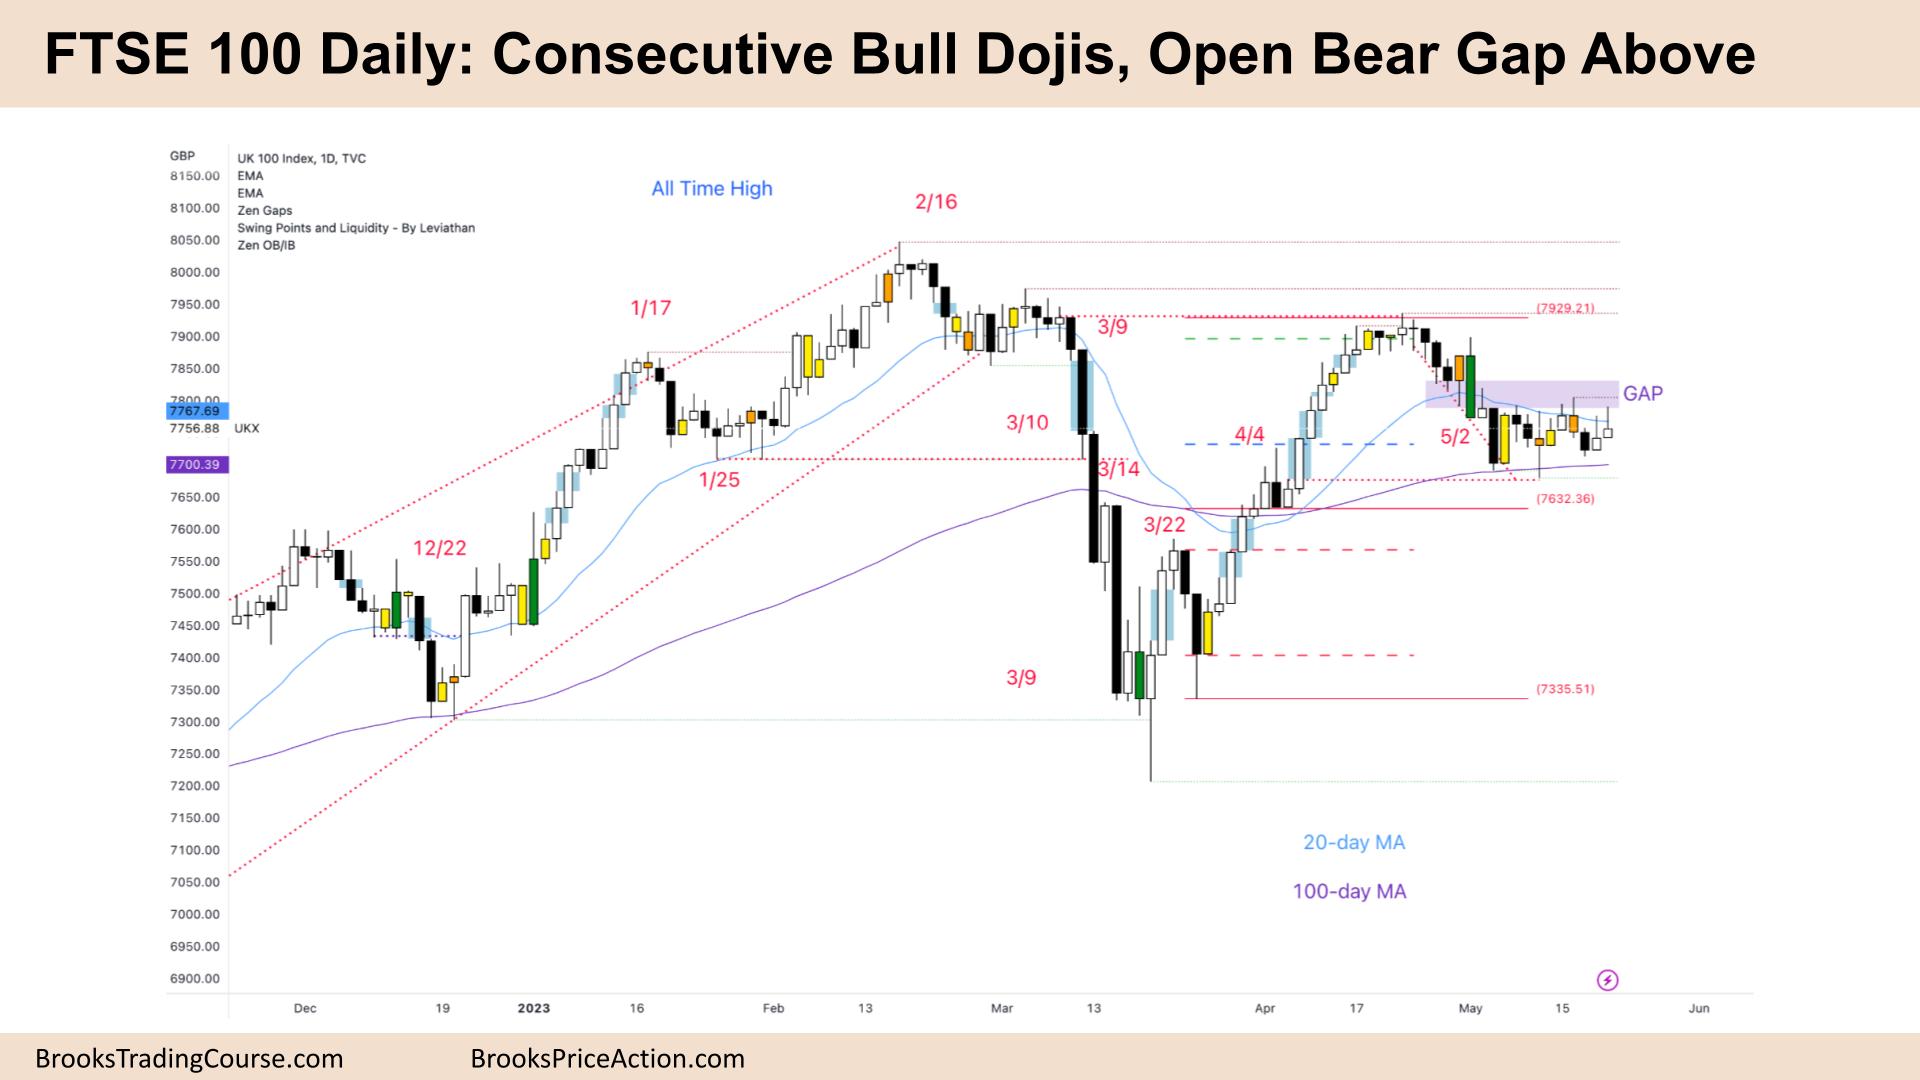
The Daily FTSE chart

- The FTSE 100 futures was a small bull doji closing near its low on Friday with a large tail above.
- Some computers will read it as a bear bar because it closed near the low and had no tail below.
- It is the second consecutive bull doji, so it is a pause in a trading range or the late stage of a broad bull channel.
- The bulls see a strong leg up to the bear breakout (BO) point and a pullback. We are about 50% of the move up from the bull breakout where the MAs crossover.
- The bears see a failed buy at the 20-bar MA, an outside down bar and then a second leg sideways to down.
- Because a reasonable buy failed above, it is now resistance above – that’s why we have tails here.
- It is a bull doji, so it is a bad buy above, and it is not a great sell below, either.
- Monday will likely trade above the high, and we will see what is up there – I’m expecting sellers.
- The sell is a scalp, not a swing, as we are between both MAs, and they are flat to up.
- We have had 2 inside bars in the last 2 weeks – it might be forming a triangle. The first breakout of a triangle fails 50% of the time.
- The bulls want a failed bear BO and then strong bull follow-through above for a move back up. The buy at the MA was reasonable, so we should get back up there.
- But as long as that gap is open, bears will sell there. The bears want that bull bar to fail and then close below.
- They want to close strongly below and get a measured move down to the original bull BO point below- where the bears got trapped.
- We are getting bear bars below the MA, so another good bear bar might force bulls to give up.
Market analysis reports archive
You can access all weekend reports on the Market Analysis page.