Market Overview: FTSE 100 Futures
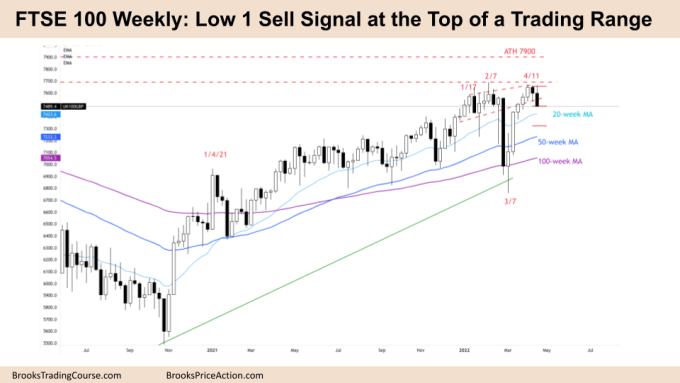
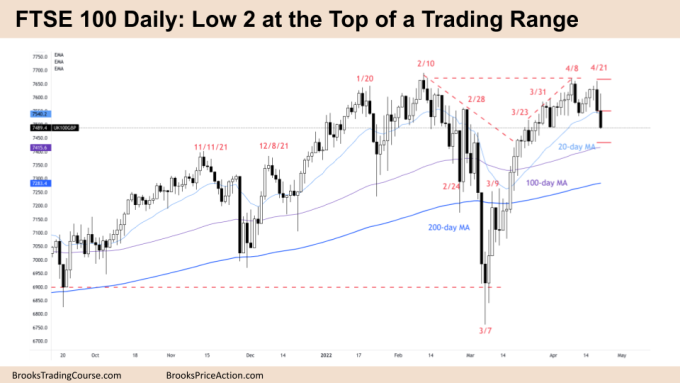
The FTSE futures market traded lower last week with consecutive bear bars near the top of trading range. It’s a Low 1 sell signal on the weekly and a Low 2 sell on the daily chart so we should move down next week. But the FTSE has failed to get 3 weekly bars for over 6 months so it reasonable we will reverse at some point next week so could go sideways as traders continue to scalp.
FTSE 100 Futures
The Weekly FTSE chart

- The FTSE 100 Weekly chart was a bear bar closing on its low so we might gap down on Monday.
- It is now 2 consecutive bear bars which the FTSE has not had in 4 months since November 2021. It has not had 3 weekly bear bars in over 6 months – the bulls know this.
- For the bulls, it’s a Low 1 pullback buy signal after a 5-week tight bull channel. The bulls expect the first pullback to be minor.
- Traders are deciding whether this is a longer-term trend resumption or a bull leg in a trading range.
- For the bears it’s a Low 1 sell signal pullback, a possible lower high major trend reversal (LH MTR), wedge reversal near the top of a trading range.
- Did you notice it’s both a Low 1 buy and a Low 1 sell? Think trading range, think sideways.
- The bulls expect the pullback to have 2 legs sideways to down to the 20-week moving average (MA) where it would be a gap-bar buy signal. A High 1 or High 2 near the MA is a high probability trade in a trend. But are we in a trend?
- In a trading range it always looks the most bullish at the top and most bearish at the bottom forcing traders to buy high and sell low. This is the opposite of a profitable trading range strategy – Buy Low Sell High and Scalp (BLSHS).
- The bears expect at least a measured move scalp from the April 11th high to below the MA and hope to reach the bottom of the March trading range but might get disappointed.
- The bears might see this as the second leg down after the first leg in February.
- If the bulls get the pullback to the MA with a reasonable tail on the bottom in the next few weeks, the bear scalpers will exit and look to sell higher with a double top.
- If the bears get the follow-through selling it would be 3 bear bars in a row and likely we will test to around the March 7th close.
- What could disappoint both sides? It is still in the tight trading range we spent 9 weeks in at the start of this year. Trading ranges always look like they are breaking out but 80% of breakouts fail.
- Is it the start of a bear trend? The bears have struggled to get consecutive bear bars for many months, they have been quick to scalp out rather than swing.
The Daily FTSE chart

- The FTSE 100 Daily reversed lower with Friday completing 2 consecutive bear bars closing on their lows so it might gap down on Monday.
- We finished last week in the same way and it reversed up strongly so it might not be as bearish as it seems.
- For the bulls, it’s 2 legs sideways to down after a 30-bar bull trend – 20 bars above the moving average (MA). A High 1 or High 2 near the MA is a high-probability buy in a bull trend. The first MA Gap bar is likely to be bought, the bears know this.
- The bears see a Low 2 sell at the top of a trading range. They see this as the start of the second leg down after a long bull trend – the first leg ending at the March lows.
- The bulls want a reversal next week with a tail below to get the High 1, but at the top of a trading range it is a low probability trade. Trading ranges force traders to buy higher than they want and sell lower than they want.
- The math favors the bears, selling in the top of a trading range is a high probability trade but look left at the context. How often did the bears get 3 daily bear bars? Maybe twice all year. It is more reasonable to assume we will reverse. Look at the tight trading ranges to the left.
- The bulls will see the reversal as support for another push higher, while the bears will look for the reversal to bring another lower high. A strong close, like an outside up bar here could force bears to close as the previous trends were so strong.
- If the bears can get a 3rd consecutive bear bar that might convince bulls to buy lower down near the 100-day MA for a double bottom High 2 buy.
Market analysis reports archive
You can access all weekend reports on the Market Analysis page.
Thanks Timothy. I’m a UK based trader and really appreciate the FTSE analysis. Keep it coming!